
An official website of the United States government
An official website of the United States government
The .gov means it's official.
Federal government websites often end in .gov or .mil. Before sharing sensitive information,
make sure you're on a federal government site.
The site is secure.
The
https:// ensures that you are connecting to the official website and that any
information you provide is encrypted and transmitted securely.
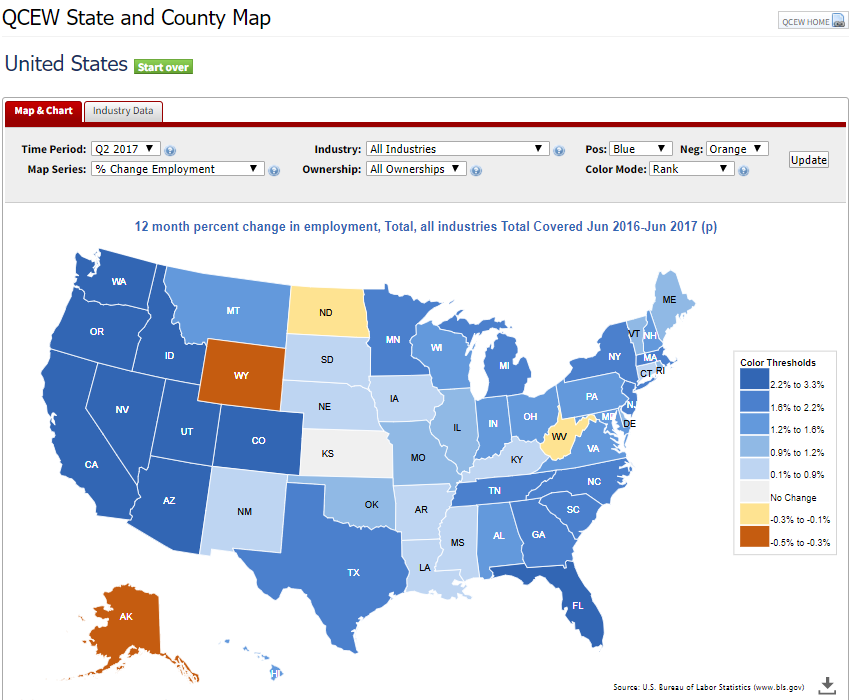
The Bureau of Labor Statistics (BLS) has developed an interactive state and county map application available at https://data.bls.gov/maps/cew/us. The application displays geographic economic data through maps, charts, and tables, allowing users to explore employment and wage data of private industry at the National, State, and county level. Throughout this application, URLs are specific to the data displayed, so links can be bookmarked, reused, and shared. The application includes maps, charts, tables, and a link to standard BLS data tables and graphs.
The maps feature displays data levels and changes at the state or county level.
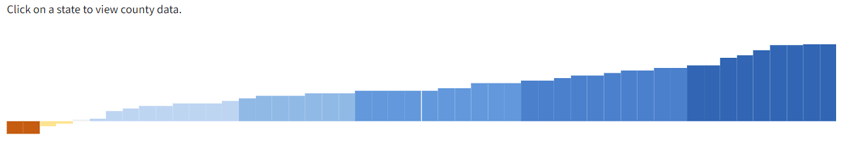
Another new data presentation tool, the charts feature (shown below), displays the distribution of the selected variable. To see the chart, select the Chart "Show" option in the map control section.
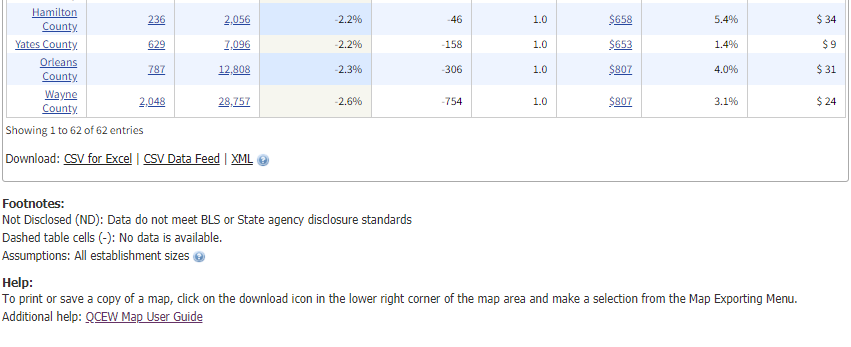
Multiple table layouts are presented depending on the level of geographic detail.
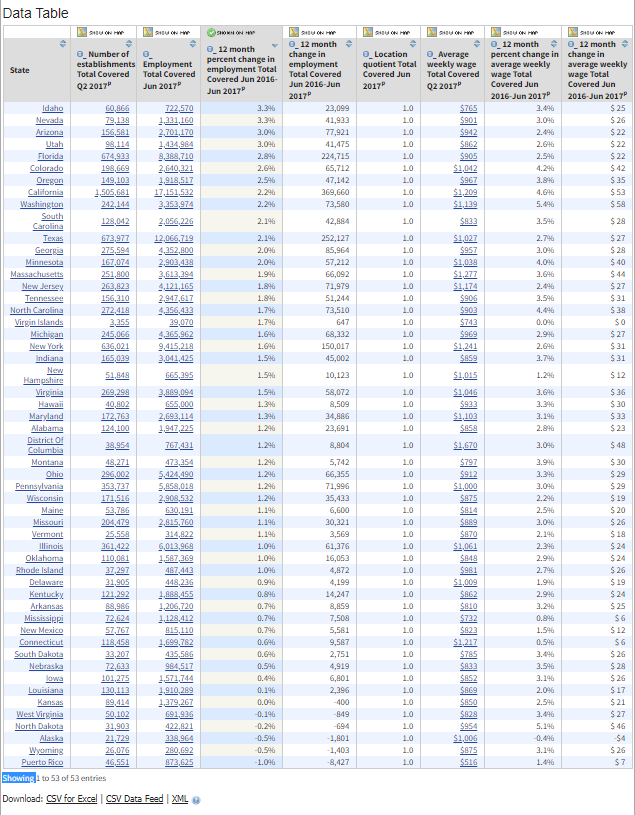
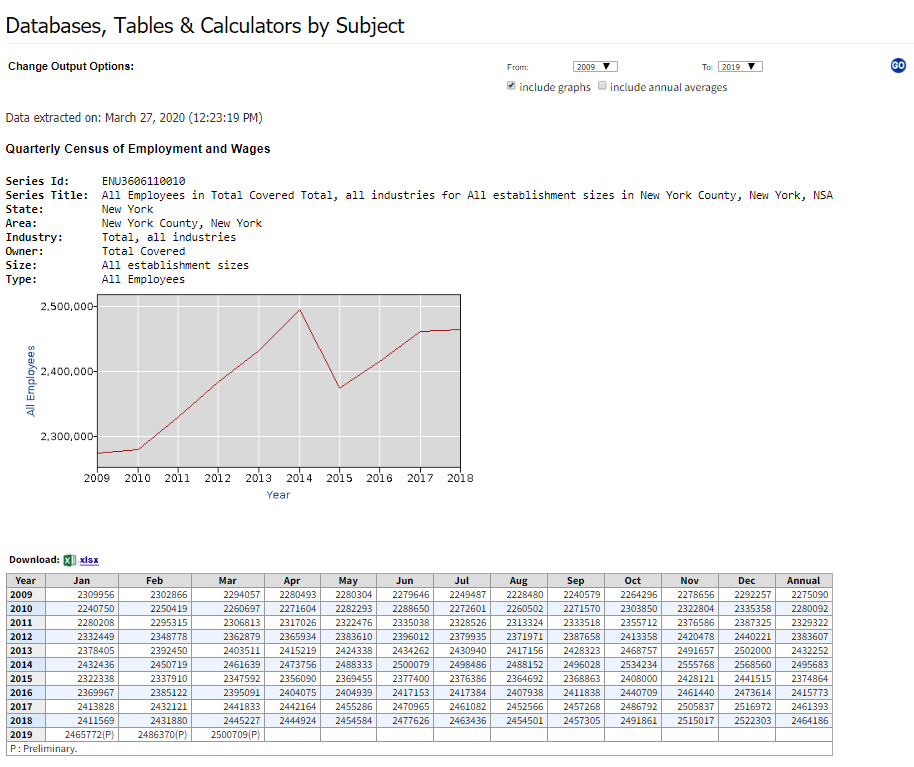
For a single-variable graph and table (shown below), click on any blue underlined value in the Map Application data table.
At the bottom of each table are download links. Each table can be downloaded as a CSV file for Microsoft Excel, a CSV data feed for use in "mash-ups", or as an XML file, preformatted for use as a web-based data source.
For more information or comments, please contact the QCEW program.