An official website of the United States government
An official website of the United States government
The .gov means it's official.
Federal government websites often end in .gov or .mil. Before sharing sensitive information,
make sure you're on a federal government site.
The site is secure.
The
https:// ensures that you are connecting to the official website and that any
information you provide is encrypted and transmitted securely.
The U.S. Bureau of Labor Statistics (BLS) Current Employment Statistics (CES) program is a monthly survey of approximately 146,000 businesses and government agencies representing roughly 623,000 worksites throughout the United States.1 CES publishes monthly, detailed industry estimates of employment, hours, and earnings of workers on nonfarm payrolls for the nation as a whole, all 50 States, the District of Columbia, Puerto Rico, the Virgin Islands, and about 450 metropolitan areas and divisions.
Given the size and complexity of the CES survey, it is inevitable that misunderstandings arise among data users. These misunderstandings range from confusion about what the survey measures, to its methodology, and even to when it is released. There is an understandable desire to translate complex statistical concepts and language into the vernacular, but doing so can also perpetuate misunderstandings about the survey. The CES program continually receives questions from the public each month that reflect some of these mistaken beliefs. This article will address some of the most common public misconceptions about the CES survey, and, in the process, clarify the scope, concepts, and methodology of the survey.
Employment
Many data users confuse CES employment with labor force concepts, estimated by the Current Population Survey (CPS).2 One reason for this confusion may be that both the CES and CPS estimates are published in the Employment Situation news release each month. Employment estimates from both the CES and CPS surveys are needed for a good understanding of the labor market. But the two surveys have different definitions of employment and distinct survey and estimation methods.3 The distinction between the two employment estimates comes from their respective data sources. CES data are collected from businesses and government agencies using their payroll data.4 CES data are an estimate of jobs and includes those jobs held by workers who received pay for any part of the reference pay period—the pay period that includes the 12th of the month. By contrast, CPS data are collected from households and are an estimate of the number of employed people, including individuals absent from work without pay. The difference between an estimate of jobs and an estimate of employed people means that CES employment data account for each job an individual works during the reference period, whereas the CPS employment data account for each employed individual. So, if an individual has two jobs, they are counted twice in CES estimates, while CPS estimates will count that person once. It is also important to note that CES employment estimates are not used to calculate the CPS unemployment rate. The unemployment rate is calculated from independently developed CPS estimates of the number of unemployed as a percent of the labor force, which is defined as the sum of employed and unemployed individuals.
CES employment estimates do not differentiate between part-time and full-time workers. The CES program asks that responding establishments provide the number of individuals who were on the payroll during any part of the survey reference period. The CPS, on the other hand, does differentiate between full-time and part-time workers; in addition, the program distinguishes between wage and salary workers, self-employed workers, and unpaid family workers.5 The CPS program also publishes a variety of demographic information on the U.S. labor force, including age, sex, race, and a variety of other characteristics.
Hourly earnings
Another common misconception regarding CES data types relates to the estimates of average hourly (or weekly) earnings. Users commonly assume that CES hourly earnings data represent wage data. However, CES earnings measures reflect the actual earnings of workers over a stated period, whereas wage rates are the amounts stipulated for a stated period or unit of output. Establishments that report their data to the CES survey for estimation are asked to report “total gross pay.” CES average earnings are a measure of gross payrolls divided by total hours paid during the reference pay period. Also, they do not represent employers’ total compensation costs, because they exclude items such as employee benefits, irregular bonuses and commissions, retroactive payments, and the employer's share of payroll taxes.
Because the CES survey has earnings data at very detailed industry levels, many businesses often attempt to use CES earnings data in contract escalation. BLS, however, recommends that CES earnings series not be used in contract escalation clauses. Instead, the Employment Cost Index (ECI)—which measures changes in labor costs free from the influence of employment shifts among industries and occupations—is a better choice for this purpose.6
CES earnings data are collected on a gross basis, meaning that, in addition to changes in basic hourly and incentive wage rates, they reflect additional forms of pay, such as premium pay (for overtime and late-shift work) and incentive pay (based on level of output). CES earnings data also reflect shifts in the number of employees between relatively high-paid and low-paid work and changes in employees’ earnings in individual establishments.
Weekly hours
Information on employee work hours is considered an indicator of the U.S economy, but it is important to understand that CES estimates of average weekly hours measure hours paid, not hours worked. Specifically, companies that report their data to the CES survey are asked to provide the total number of hours for which employees received pay. These total hours include all hours (including overtime hours) paid for standby or reporting time, and equivalent hours for which employees received pay directly from the employer for sick leave, holidays, vacations, and other leave. This concept of total hours differs from those of scheduled hours and hours worked.7 As an example, consider a salaried individual working for company A. The employee works 46 hours during the pay period that includes the 12th of the month, but, because the employee is salaried, he or she is paid for only 40 hours. It is this 40 hours that is included by company A, along with the paid hours of the employee's coworkers, in the company's CES report.
Another common misconception is that the CES survey does not account for small firms in its estimates. In fact, roughly 40 percent of the survey sample is composed of establishments with fewer than 20 employees. In order to have an accurate and reliable estimate of total nonfarm employment, businesses of all sizes in all industries must be appropriately sampled. Therefore, sample data are weighted to represent other firms in the same state, industry, and size class. For instance, some large firms are automatically selected and assigned a weight of 1, meaning they represent only themselves. In contrast, smaller firms are selected with less frequency. Of these smaller firms, 1 in every 100 might be selected and assigned a weight of 100, meaning that those firms represent both themselves and 99 other firms that were not sampled. Assigning weights to sample data ensures that all firms of its size are adequately represented and helps prevent a large- or small-firm bias in the estimate. Also, the CES survey provides publicly available tables that are helpful for understanding the CES sample by employment size.8
This misunderstanding about the representation of small firms may stem from confusion about the model that CES uses to account for new firms. There is an unavoidable lag between the time a new company is “born” and the time the CES program is able to capture that new company in the sample. To account for businesses that are born and die off, the CES survey relies on a birth/death model that increases the accuracy of the monthly nonfarm payroll estimate because it models employment growth generated by new firms—and that employment growth cannot be captured in the sample. Likewise, there is generally a lag between when a firm dies and when it is removed from the sample. The model accounts for employment losses by firms going out of business during monthly sample collection. (The CES program may not know until after the collection period that a firm has gone out of business, because such a firm may appear not to have responded to the CES survey.) Information on business deaths eventually become available from lagged administrative records.9
There is often a lot of confusion about seasonally adjusted CES data. Some of the misunderstandings surround the concept of seasonal adjustment, and others surround its methodology. Seasonal adjustment removes the part of monthly employment change caused by regularly occurring seasonality from the estimates, leaving behind only the cyclical and irregular movements. Most series published by the CES program show a regularly recurring seasonal movement that can be measured from past experience. For example, each year, employment in the retail trade and transportation industries rises prior to the Christmas holiday season and falls after the holiday. By accounting for the employment changes that follow these recurring seasonal movements, it is possible to observe the cyclical and other nonseasonal movements in these industries. Seasonally adjusted estimates are the headline numbers in the Employment Situation news release because they allow for the month-to-month analysis of estimates without the influence of seasonal swings, making seasonal adjustment the most efficient way to analyze trends.
Although the seasonally adjusted figure generally receives the most attention, both the seasonally adjusted and not seasonally adjusted numbers are published in the Employment Situation news release. To be completely transparent, the CES program provides detailed descriptions of the methodology used to calculate the seasonally adjusted estimates and all information, files, and data necessary to duplicate the seasonally adjusted data.10
The 4- versus 5-week calendar effect
Occasionally, a calendar effect can distort CES estimates. One prominent example is the 4- versus 5-week calendar effect. In any given pair of months, there may be either 4 weeks or 5 weeks between survey reference periods. The 4- versus 5-week adjustment used in the CES program’s seasonal adjustment procedures adjusts for inconsistencies in CES estimates that arise because of these varying periods. For example, in figure 1, there are 4 weeks between the December 2012 reference week and the January 2013 reference week, during which firms can hire or lay off employees. Between the December 2013 reference week and the January 2014 reference week, there are 5 weeks for firms to hire or lay off employees.
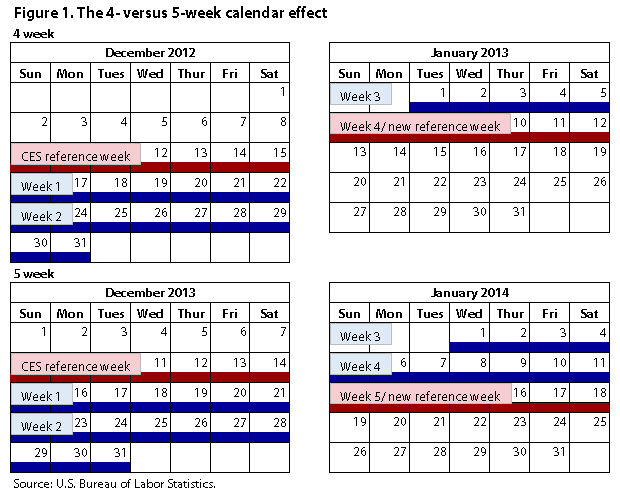
During months of high seasonal employment, a 1-week variation in highly seasonal industries can be sizeable. For example, employment in holiday-related retail trade industries decreased (not seasonally adjusted) by 535,000 in January 2013—a 4-week reference period—whereas in January 2014—a 5-week reference period—employment decreased by 584,000.11 The CES seasonal adjustment process accounted for this difference by expecting a larger seasonal movement when there was an extra week between the survey reference weeks. In this case, the seasonal adjustment process expected layoffs totaling 575,000 in January 2014, compared with expected layoffs of 563,000 in January 2013—an extra 12,000 jobs. This is just one example, but it shows how the difference of a single week between reference periods can have a notable effect.
Tables 1, 2, and 3 show how an additional week between reference periods can affect not seasonally adjusted data, normal seasonal movement data, and seasonally adjusted data, respectively.
| Year | October | November | December | January | |
|---|---|---|---|---|---|
2010–11 | 150 | 339 | 159 | -560 | |
2011–12 | 134 | 391 | 155 | -562 | |
2012–13 | 139 | 485 | 100 | -604 | |
2013–14 | 160 | 443 | 184 | -669 | |
2014–15 | 183 | 412 | 154 | -627 | |
2015–16 | 195 | 410 | 135 | -586 | |
Note: Shade denotes 5 weeks between survey reference weeks. Source: U.S. Bureau of Labor Statistics. | |||||
| Year | October | November | December | January | |
|---|---|---|---|---|---|
2010–11 | 124 | 364 | 160 | -622 | |
2011–12 | 132 | 380 | 149 | -620 | |
2012–13 | 116 | 410 | 136 | -646 | |
2013–14 | 128 | 412 | 136 | -660 | |
2014–15 | 169 | 354 | 156 | -660 | |
2015–16 | 173 | 358 | 128 | -652 | |
Note: Shade denotes 5 weeks between survey reference weeks. Source: U.S. Bureau of Labor Statistics. | |||||
| Year | October | November | December | January | |
|---|---|---|---|---|---|
2010–11 | 26 | -25 | -2 | 62 | |
2011–12 | 3 | 11 | 6 | 58 | |
2012–13 | 23 | 76 | -37 | 42 | |
2013–14 | 31 | 31 | 48 | -9 | |
2014–15 | 13 | 59 | -2 | 33 | |
2015–16 | 21 | 52 | 7 | 67 | |
Note: Shade denotes 5 weeks between survey reference weeks. Source: U.S. Bureau of Labor Statistics. | |||||
The CES program first incorporated the 4- versus 5-week adjustment with the release of May 1996 data. At that time, historical estimates were revised for the 4- versus 5-week calendar effect back to January 1986.12
Because CES estimates are revised on a monthly and on an annual basis, it appears to the public that the estimates are inaccurate.
Estimates are revised as more complete data become available, and these revisions more accurately reflect what is occurring in the economy.13 The CES program continuously receives data from respondents, but because pay periods differ across companies, some of the data for the reference pay period will not be available from all respondents in time to be included in the estimation process prior to the publication of the Employment Situation news release. The CES program often discourages users from placing too much emphasis on data from any single month and encourages them instead to analyze data series over a longer term. In fact, CES began publishing 3-month moving averages for that very purpose.
The long-term accuracy of CES estimates is best measured by analyzing annual CES benchmark revisions, a process in which CES employment estimates are re-anchored, or reconciled, with near-population employment counts available from BLS Quarterly Census of Employment and Wages data, U.S. Census Bureau County Business Patterns data, and other state-collected data. The benchmark helps to control for sampling error in the estimates. Historically, benchmark revisions have been small. Over the last 10 years, annual benchmark revisions have averaged 0.3 percent of total nonfarm employment, with an absolute range from 0.0 percent to 0.7 percent. This small percentage suggests an absence of bias, even though there is variability.14
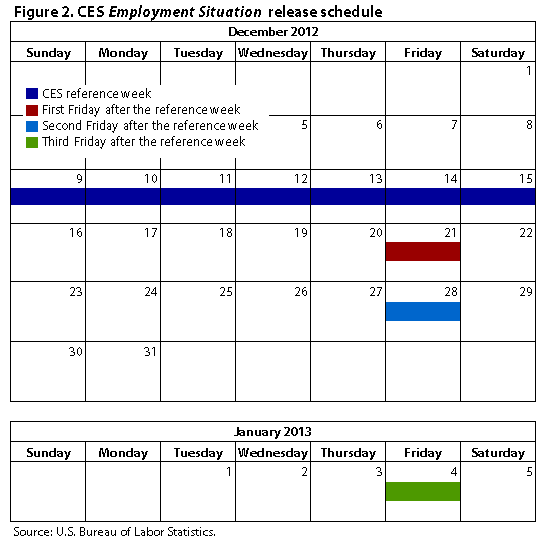
Data users often misunderstand when the Employment Situation news release is scheduled to be published. The CES program is often questioned when the news release is scheduled for the second Friday of the month. Many incorrectly believe that the Employment Situation is always released on the first Friday of the month. As a rule, the Employment Situation news release is scheduled for the third Friday after the conclusion of the survey reference week—the week that includes the 12th day of the month. (See figure 2.) Still, there are a few notable exceptions to this rule. If the third Friday after the survey reference week is a federal holiday, the Employment Situation is released one day early. Also, if, for any reason, the government is not operating, the release may be postponed; however, there are reasonable measures in place to ensure a timely release. In addition, there is a special exception for the December data released in January. If the third Friday after the reference week falls on January 1, 2, or 3, the news release is issued the next week. The Employment Situation release dates are finalized and released by the Office of Management and Budget in advance and are then published by BLS.15
This article is designed to address a few of the most common misconceptions about the CES survey and, in so doing, help data users better understand what CES estimates represent. The article examines several general concepts, including the difference between a count of jobs and a count of employed people, the distinction between average hourly earnings and wages, and the difference between hours paid and hours worked. Contrary to popular belief, the Employment Situation news release is not always released on the first Friday of the month. Rather, with few exceptions, the release is scheduled for the third Friday following the week that includes the 12th of the month. Small firms are accounted for in the survey. CES estimates are seasonally adjusted to make it easier for users to analyze employment, hours, and earnings trends. Both seasonally adjusted estimates and estimates that are not seasonally adjusted are available, and the seasonal adjustment process can be replicated by using resources available on the CES website. Lastly, the accuracy of CES estimates was addressed. Historical benchmark revisions are the best method to gauge the accuracy of CES estimates.
The CES program helps support the mission of BLS to collect, analyze, and disseminate essential economic information to support public and private decisionmaking. The Bureau of Labor Statistics is an independent and apolitical statistical agency that serves its diverse user communities by providing products and services that are accurate, objective, relevant, timely, and accessible.
Michael Calvillo and Tyler Downing, "One hundred years of Current Employment Statistics: busting CES myths," Monthly Labor Review, U.S. Bureau of Labor Statistics, October 2016, https://doi.org/10.21916/mlr.2016.48
1 For more information on CES survey concepts and methodology, see https://www.bls.gov/web/empsit/cestn.htm. For national CES data, see https://www.bls.gov/ces. For state and metropolitan area CES data, see http:www.bls.gov/sae.
2 For more information on the Current Population Survey, see https://www.bls.gov/cps/.
3 For more information on the differences between the CES survey and the CPS survey, see https://www.bls.gov/web/empsit/ces_cps_trends.htm.
4 For a sample CES data collection form, see https://www.bls.gov/ces/idcf/forme_sp.pdf.
5 For definitions of class-of-worker categories, see https://www.bls.gov/cps/lfcharacteristics.htm#self.
6 The National Compensation Survey provides comprehensive measures of occupational earnings, compensation cost trends, benefit incidence, and detailed plan provisions. For more information on how to use the ECI for contract adjustments, see https://www.bls.gov/ncs/ect/escalator.htm.
7 “Chapter 2. Employment, hours, and earnings from the establishment survey,” BLS Handbook of Methods (U.S. Bureau of Labor Statistics), https://www.bls.gov/opub/hom/pdf/homch2.pdf.
8 "Table 3, Total private universe employment by size of UI," https://www.bls.gov/web/empsit/cestn.htm#Tb3.
9 For a detailed look at the specific methodology the CES program uses to account for new firms and firms going out of business, see https://www.bls.gov/web/empsit/cestn.htm#section5c.
10 For technical information about seasonal adjustment, see https://www.bls.gov/web/empsit/cesseasadj.htm.
11 Includes employment only from furniture and home furnishings stores; electronics and appliance stores; other specialty food stores; health and personal care stores; clothing and clothing accessories stores; sporting goods, hobby, book, and music stores; general merchandise stores; miscellaneous store retailers; and electronic shopping and mail-order houses.
12 For a discussion of these 4- versus 5-week inconsistencies in the CES estimates, see Stephanie Cano, Patricia Getz, Jurgen Kropf, and George Stamas, Adjusting for a Calendar Effect in Employment Time Series (U.S. Bureau of Labor Statistics) is available www.bls.gov/osmr/research-papers/1996/pdf/st960190.pdf.
13For more information on revisions to the jobs numbers, see Thomas Nardone, Kenneth Robertson, and Julie Hatch Maxfield, “Why are there revisions to the jobs numbers?” Beyond the Numbers (U.S. Bureau of Labor Statistics, July 2013), https://www.bls.gov/opub/btn/volume-2/revisions-to-jobs-numbers.htm.
14 For more information on the CES benchmark, see https://www.bls.gov/ces/tables/#benchmark.
15 For CES news release dates, see https://www.bls.gov/ces/publications/news-release-schedule.htm; The schedule of release dates for Principal Federal Economic Indicators, which includes the Employment Situation news release, is available at https://obamawhitehouse.archives.gov/omb/inforeg_statpolicy.