An official website of the United States government
An official website of the United States government
The .gov means it's official.
Federal government websites often end in .gov or .mil. Before sharing sensitive information,
make sure you're on a federal government site.
The site is secure.
The
https:// ensures that you are connecting to the official website and that any
information you provide is encrypted and transmitted securely.
24-843-CHI
Friday, May 03, 2024
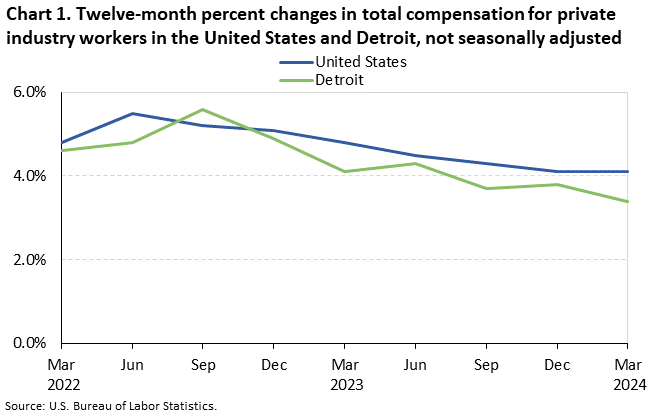
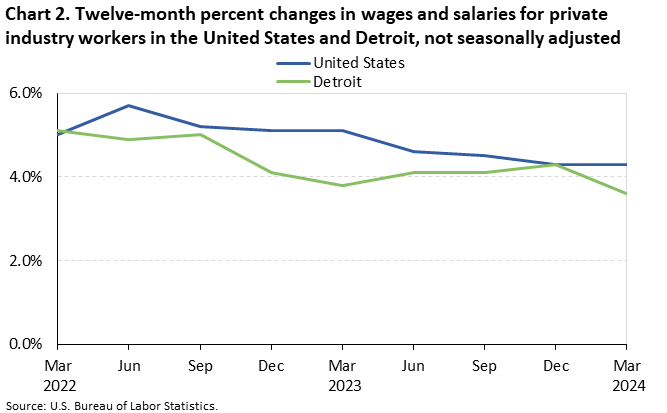
Compensation costs for private industry workers increased 3.4 percent in the Detroit-Warren-Ann Arbor, MI Combined Statistical Area (CSA) for the year ended March 2024, the U.S. Bureau of Labor Statistics reported today. Regional Commissioner Jason Palmer noted that one year ago, Detroit experienced an annual gain of 4.1 percent in compensation costs. (See chart 1 and table 1.) Locally, wages and salaries, the largest component of compensation costs, advanced at a 3.6-percent pace for the 12-month period ended March 2024. (See chart 2.) Nationwide, compensation costs rose 4.1 percent and wages and salaries rose 4.3 percent over the same period.
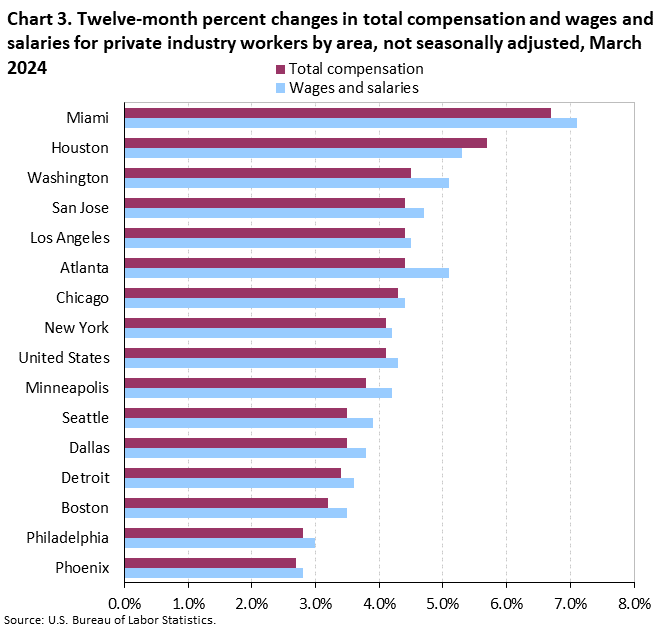
Detroit is 1 of 15 metropolitan areas in the United States and 1 of 3 areas in the Midwest region of the country for which locality compensation cost data are available. Among these 15 largest areas, over-the-year percentage changes in compensation costs ranged from 6.7 percent in Miami-Fort Lauderdale-Port St. Lucie to 2.7 percent in Phoenix-Mesa-Scottsdale in March 2024; for wages and salaries, Miami registered the largest increase (7.1 percent), and Phoenix registered the smallest (2.8 percent). (See chart 3.)
The annual increase in compensation costs in Detroit was 3.4 percent in March 2024, compared to 4.3 percent in Chicago-Naperville and 3.8 percent in Minneapolis-St. Paul, the two other metropolitan areas in the Midwest. Detroit’s 3.6-percent gain in wages and salaries over this 12-month period compared to 4.2 percent in Minneapolis and 4.4 percent in Chicago. (See table 2.)
Locality compensation costs are part of the national Employment Cost Index (ECI), which measures quarterly changes in compensation costs, which include wages and salaries and employer costs for employee benefits. In addition to the 15 locality estimates provided in this release, ECI data for the nation, 4 geographical regions, and 9 geographical divisions are available. (Geographical definitions for the metropolitan areas mentioned in this release are included in the Technical Note.)
In addition to the data presented here, national data by industry, occupational group, and union status, as well as data for civilian, private, and state and local government employees, are available at www.bls.gov/ncs/ect/home.htm. The national news release summary is available at www.bls.gov/news.release/eci.nr0.htm. Additional information for regions, states, and local areas may be accessed via our regional homepage at www.bls.gov/regions/midwest/.
The Employment Cost Index for June 2024 is scheduled to be released on Wednesday, July 31, 2024, at 8:30 a.m. (ET).
| Area | Total compensation | Wages and salaries | ||||||
|---|---|---|---|---|---|---|---|---|
| 12-month percent changes for period ended- | 12-month percent changes for period ended- | |||||||
| Mar. | Jun. | Sep. | Dec. | Mar. | Jun. | Sep. | Dec. | |
|
United States |
||||||||
|
2020 |
2.8 | 2.7 | 2.4 | 2.6 | 3.3 | 2.9 | 2.7 | 2.8 |
|
2021 |
2.8 | 3.1 | 4.1 | 4.4 | 3.0 | 3.5 | 4.6 | 5.0 |
|
2022 |
4.8 | 5.5 | 5.2 | 5.1 | 5.0 | 5.7 | 5.2 | 5.1 |
|
2023 |
4.8 | 4.5 | 4.3 | 4.1 | 5.1 | 4.6 | 4.5 | 4.3 |
|
2024 |
4.1 | 4.3 | ||||||
|
Midwest |
||||||||
|
2020 |
3.0 | 2.6 | 2.4 | 2.5 | 3.5 | 2.9 | 2.7 | 2.6 |
|
2021 |
2.3 | 3.1 | 3.8 | 4.6 | 2.2 | 3.3 | 4.1 | 5.1 |
|
2022 |
5.1 | 5.7 | 5.8 | 5.0 | 5.5 | 6.0 | 6.0 | 5.0 |
|
2023 |
4.5 | 4.3 | 3.8 | 3.7 | 4.6 | 4.4 | 3.9 | 4.0 |
|
2024 |
3.9 | 4.2 | ||||||
|
Detroit-Warren-Ann Arbor |
||||||||
|
2020 |
2.7 | 2.3 | 2.7 | 3.1 | 3.7 | 3.0 | 3.0 | 2.9 |
|
2021 |
3.1 | 2.7 | 2.6 | 3.3 | 2.5 | 2.8 | 2.7 | 3.7 |
|
2022 |
4.6 | 4.8 | 5.6 | 4.9 | 5.1 | 4.9 | 5.0 | 4.1 |
|
2023 |
4.1 | 4.3 | 3.7 | 3.8 | 3.8 | 4.1 | 4.1 | 4.3 |
|
2024 |
3.4 | 3.6 | ||||||
| Area | Total compensation | Wages and salaries | ||||
|---|---|---|---|---|---|---|
| 12-month percent changes for period ended- | 12-month percent changes for period ended- | |||||
| Mar. 2023 | Dec. 2023 | Mar. 2024 | Mar. 2023 | Dec. 2023 | Mar. 2024 | |
|
United States |
4.8 | 4.1 | 4.1 | 5.1 | 4.3 | 4.3 |
|
Northeast |
4.5 | 3.8 | 3.8 | 4.4 | 3.9 | 3.9 |
|
Boston-Worcester-Providence |
3.9 | 3.1 | 3.2 | 4.0 | 3.4 | 3.5 |
|
New York-Newark |
4.6 | 4.2 | 4.1 | 4.3 | 4.3 | 4.2 |
|
Philadelphia-Reading-Camden |
5.7 | 4.4 | 2.8 | 6.5 | 4.7 | 3.0 |
|
South |
5.2 | 4.4 | 4.3 | 5.4 | 4.6 | 4.6 |
|
Atlanta-Athens-Clarke County-Sandy Springs |
5.1 | 3.8 | 4.4 | 5.6 | 4.4 | 5.1 |
|
Dallas-Fort Worth |
5.2 | 3.5 | 3.5 | 5.1 | 3.7 | 3.8 |
|
Houston-The Woodlands |
3.5 | 5.2 | 5.7 | 3.4 | 4.9 | 5.3 |
|
Miami-Fort Lauderdale-Port St. Lucie |
6.1 | 5.5 | 6.7 | 6.0 | 5.1 | 7.1 |
|
Washington-Baltimore-Arlington |
5.5 | 4.4 | 4.5 | 5.7 | 4.9 | 5.1 |
|
Midwest |
4.5 | 3.7 | 3.9 | 4.6 | 4.0 | 4.2 |
|
Chicago-Naperville |
3.8 | 4.1 | 4.3 | 3.5 | 4.1 | 4.4 |
|
Detroit-Warren-Ann Arbor |
4.1 | 3.8 | 3.4 | 3.8 | 4.3 | 3.6 |
|
Minneapolis-St. Paul |
4.0 | 3.6 | 3.8 | 4.3 | 3.7 | 4.2 |
|
West |
5.1 | 4.1 | 4.1 | 5.6 | 4.4 | 4.3 |
|
Los Angeles-Long Beach |
4.7 | 4.5 | 4.4 | 4.9 | 5.0 | 4.5 |
|
Phoenix-Mesa-Scottsdale |
4.6 | 4.1 | 2.7 | 5.2 | 4.4 | 2.8 |
|
San Jose-San Francisco-Oakland |
4.4 | 2.7 | 4.4 | 4.7 | 2.8 | 4.7 |
|
Seattle-Tacoma |
2.6 | 3.8 | 3.5 | 5.9 | 4.3 | 3.9 |
Last Modified Date: Friday, May 03, 2024