An official website of the United States government
An official website of the United States government
The .gov means it's official.
Federal government websites often end in .gov or .mil. Before sharing sensitive information,
make sure you're on a federal government site.
The site is secure.
The
https:// ensures that you are connecting to the official website and that any
information you provide is encrypted and transmitted securely.
Elizabeth Cross | February 2017
“…Panem, the country that rose up out of the ashes of a place that was once called North America.” – The Hunger Games (Scholastic Press)
In The Hunger Games, author Suzanne Collins never reveals the exact locations of the Districts of Panem. What if you could map them by using data from the U.S. Bureau of Labor Statistics (BLS)?

Fans of the popular The Hunger Games trilogy know that the stories are set in Panem, a futuristic area previously called North America, with a capital located somewhere in what was known as the Rockies. Panem is divided into districts, each of which has a primary industry. BLS employment data can help you solve the puzzle of where in North America those districts would be.
Keep reading to learn how to use BLS data to identify 12 districts of Panem. Because BLS data cover the United States, this article uses clues from U.S. locations rather than from North America as a whole.
Each district’s primary industry offers the best evidence of its geographic location. To find where an industry has a high concentration of workers, look at employment data by industry and occupation. Industry employment data tell you how many workers are in a particular type of firm or group of firms; occupation employment data tell you how many workers do a similar set of tasks.
Two BLS sources of employment data that will help in your analysis are the Quarterly Census of Employment and Wages (QCEW) and the Occupational Employment Statistics (OES) programs. QCEW data show industry employment and are provided here at the county level. OES data for occupation employment are shown here for metropolitan and nonmetropolitan statistical areas.

Total employment. Total employment can show you where lots of workers are in an industry or occupation. But the total number employed also may highlight areas where there are a lot of workers in every industry or occupation, such as large cities. Identifying a large number of workers doesn’t give you enough information for locating the districts.
Instead, you want to find where there are high concentrations of workers in a particular industry or occupation compared with the nation as a whole. For that, you’ll need the location quotient.
Location quotient. The location quotient is a ratio of the percentage of workers in an industry or occupation in a certain area to the percentage of workers in that industry or occupation nationally. A location quotient greater than 1.0 indicates a higher-than-average concentration for an industry or occupation.
For example, according to the 2015 OES estimates, actors make up .0367 percent of national employment. However, more than one-third of all actor employment is concentrated in California and makes up .1103 percent of that state’s total employment. To calculate the location quotient for actors in California, you divide the percentage of the occupation’s employment in California (.1103) by the percentage of employment nationally (.0367) to get a ratio of 3.01—indicating a higher-than-average concentration of actors in California. (See illustration.)
“Even hundreds of years ago, they mined coal here.” –The Hunger Games
To use data to find the districts of Panem, you’ll need to look for areas with the highest location quotients for the industries and occupations associated with each district. Begin with the district in which Katniss Everdeen, the protagonist of The Hunger Games, lived.

Industry location quotients. Using QCEW annual averages for 2015, chart 1 ranks the counties with the highest location quotients for the coal mining industry. Mingo County, West Virginia, had the highest location quotient.
In the United States, there were 64,135 workers in the coal mining industry out of 139,491,699 total workers, or about .05 percent. In Mingo County, there were 1,216 workers in the coal mining industry out of 5,563 total workers. Thus, (1,216/5,563) × 100 percent, or about 22 percent, of the workers in Mingo County were employed in coal mining.
| County | Location quotient |
|---|---|
|
Mingo County, West Virginia |
475.42 |
|
Boone County, West Virginia |
474.38 |
|
Campbell County, Wyoming |
390.57 |
|
Greene County, Pennsylvania |
386.95 |
|
Buchanan County, Virginia |
320.3 |
|
Martin County, Kentucky |
253.99 |
|
Logan County, West Virginia |
244.36 |
|
Perry County, Kentucky |
218.08 |
|
Leslie County, Kentucky |
211.69 |
|
Carbon County, Utah |
146.01 |
| Source: U.S. Bureau of Labor Statistics, Quarterly Census of Employment and Wages. | |
To get the location quotient, divide the percentage of workers in coal mining in Mingo County (22) by the percentage nationally (.05). The result is a ratio of 440. (The data used to calculate this number were rounded to simplify the math, so the value shown here differs from the value shown in chart 1.) In other words, Mingo County has more than 400 times the concentration of coal mining employment nationally.
Mapping the industry location quotients shows a concentration of coal mining in an area that encompasses Kentucky, West Virginia, and Pennsylvania. (See map.)

| County | Location quotient |
|---|---|
|
Mingo County, West Virginia |
475.42 |
|
Boone County, West Virginia |
474.38 |
|
Campbell County, Wyoming |
390.57 |
|
Greene County, Pennsylvania |
386.95 |
|
Buchanan County, Virginia |
320.3 |
|
Martin County, Kentucky |
253.99 |
|
Logan County, West Virginia |
244.36 |
|
Perry County, Kentucky |
218.08 |
|
Leslie County, Kentucky |
211.69 |
|
Carbon County, Utah |
146.01 |
|
Raleigh County, West Virginia |
120.77 |
|
Letcher County, Kentucky |
116.29 |
|
Bell County, Kentucky |
107.4 |
|
Pike County, Indiana |
85.7 |
|
Nicholas County, West Virginia |
59.23 |
|
Warrick County, Indiana |
45.27 |
|
Johnson County, Kentucky |
40.15 |
|
Kanawha County, West Virginia |
26.02 |
|
Clearfield County, Pennsylvania |
19.47 |
|
Jefferson County, Pennsylvania |
15.02 |
|
Knox County, Kentucky |
9.68 |
|
Jefferson County, Alabama |
7.99 |
|
Cambria County, Pennsylvania |
6.16 |
|
Harrison County, West Virginia |
5.64 |
|
Northumberland County, Pennsylvania |
4.99 |
|
Luzerne County, Pennsylvania |
3.96 |
|
Butler County, Pennsylvania |
2.48 |
|
Westmoreland County, Pennsylvania |
1.19 |
|
Stark County, Ohio |
0.19 |
|
Centre County, Pennsylvania |
0.19 |
|
Allegheny County, Pennsylvania |
0.05 |
|
Harris County, Texas |
0.01 |
|
Source: U.S. Bureau of Labor Statistics, Quarterly Census of Employment and Wages. |
|
Occupation location quotients. In addition to using industry data to see where coal mining employment is concentrated, you can use occupation data to search for District 12. Occupation employment in the coal mining industry helps you find the occupation in which that industry is the largest employer.
As table 1 shows, nearly all mine shuttle car operators worked in the coal mining industry in 2015. Mine shuttle car operators use shuttle cars to transport materials in underground mines. Location quotients for mine shuttle car operators are a good indicator of where mining activity is concentrated.
| Occupation | Percent of occupation in coal mining | Total employment | Employment in coal mining |
|---|---|---|---|
| Mine shuttle car operators | 93.5 | 2,310 | 2,160 |
| Roof bolters, mining | 93.1 | 5,220 | 4,860 |
| Loading machine operators, underground mining | 60.7 | 3,210 | 1,950 |
| Source: U.S. Bureau of Labor Statistics, Occupational Employment Statistics. | |||
Using the 2015 OES estimates, chart 2 ranks the metropolitan and nonmetropolitan areas with the highest location quotients for mine shuttle car operators. With a location quotient of 163.50, the Southern West Virginia nonmetropolitan area had the highest location quotient for mine shuttle car operators. This nonmetropolitan area comprises many counties, including Mingo County.
| Area | Location quotient |
|---|---|
|
Southern West Virginia nonmetropolitan area |
163.50 |
|
Beckley, West Virginia |
129.21 |
|
West Kentucky nonmetropolitan area |
115.49 |
|
East Kentucky nonmetropolitan area |
108.35 |
|
Northern West Virginia nonmetropolitan area |
72.26 |
|
Western Pennsylvania nonmetropolitan area |
64.46 |
|
Eastern Utah nonmetropolitan area |
43.92 |
|
Southwest Wyoming nonmetropolitan area |
35.43 |
|
Southwest Colorado nonmetropolitan area |
22.34 |
| Source: U.S. Bureau of Labor Statistics, Occupational Employment Statistics. | |
Conclusion. On the basis of statistical evidence, District 12 is most likely located in an area comprising parts of Kentucky, West Virginia, and Pennsylvania. This tristate area is where employment in the coal mining industry and its associated occupations are concentrated.
Every district of Panem has a dominant industry. Profiles for each district use QCEW and OES data; links to these industry profiles for each district are given below. The data may provide clues, but results are open to interpretation. Using these data, create your own map of Panem.
“And may the odds be ever in your favor.” –The Hunger Games

District 3: Electronic goods manufacturing
District 6: Transportation manufacturing
Note: The North American Industry Classification System groups this industry under “other miscellaneous manufacturing.”
| County | Location quotient |
|---|---|
|
Steele County, Minnesota |
18.99 |
|
Price County, Wisconsin |
18.41 |
|
Bedford County, Tennessee |
17.98 |
|
Randolph County, Indiana |
16.03 |
|
Clearwater County, Idaho |
10.87 |
|
Washington County, Maine |
9.59 |
|
Wyandot County, Ohio |
9.36 |
|
Davis County, Utah |
9.33 |
|
Barbour County, Alabama |
8.78 |
|
Northampton County, Pennsylvania |
8.21 |
| Source: U.S. Bureau of Labor Statistics, Quarterly Census of Employment and Wages. | |

| County | Location quotient |
|---|---|
|
Steele County, Minnesota |
18.99 |
|
Price County, Wisconsin |
18.41 |
|
Bedford County, Tennessee |
17.98 |
|
Randolph County, Indiana |
16.03 |
|
Clearwater County, Idaho |
10.87 |
|
Washington County, Maine |
9.59 |
|
Wyandot County, Ohio |
9.36 |
|
Davis County, Utah |
9.33 |
|
Barbour County, Alabama |
8.78 |
|
Northampton County, Pennsylvania |
8.21 |
|
Rush County, Indiana |
8.02 |
|
Carter County, Tennessee |
7.75 |
|
Washington County, Texas |
7.09 |
|
Bristol County, Massachusetts |
6.77 |
|
Providence County, Rhode Island |
6.49 |
|
Walworth County, Wisconsin |
6.36 |
|
Surry County, North Carolina |
6.3 |
|
Gallatin County, Montana |
6.18 |
|
Lafayette Parish, Louisiana |
5.37 |
|
Pipestone County, Minnesota |
5.28 |
|
West Baton Rouge Parish, Louisiana |
5.2 |
|
Lake County, Ohio |
5.14 |
|
Washoe County, Nevada |
5.09 |
|
Poweshiek County, Iowa |
5.08 |
|
Broomfield County, Colorado |
4.96 |
|
Yamhill County, Oregon |
4.92 |
|
Josephine County, Oregon |
4.46 |
|
Hernando County, Florida |
4.23 |
|
Baxter County, Arkansas |
4.15 |
|
Montrose County, Colorado |
3.96 |
|
Portage County, Ohio |
3.74 |
|
Unknown Or Undefined, Michigan |
3.66 |
|
Wayne County, North Carolina |
3.6 |
|
Robertson County, Tennessee |
3.54 |
|
Anoka County, Minnesota |
3.47 |
|
Elkhart County, Indiana |
3.46 |
|
Jefferson County, Illinois |
3.42 |
|
Allegany County, New York |
3.41 |
|
Putnam County, Tennessee |
3.4 |
|
Blue Earth County, Minnesota |
3.26 |
|
Iron County, Utah |
3.08 |
|
Champaign County, Illinois |
3.02 |
|
Allen County, Indiana |
3 |
|
Cabarrus County, North Carolina |
2.92 |
|
Crawford County, Ohio |
2.88 |
|
Carver County, Minnesota |
2.86 |
|
Pennington County, South Dakota |
2.71 |
|
Bennington County, Vermont |
2.7 |
|
Lake County, Illinois |
2.62 |
|
Blair County, Pennsylvania |
2.62 |
|
Mifflin County, Pennsylvania |
2.57 |
|
Cowlitz County, Washington |
2.55 |
|
Kane County, Illinois |
2.54 |
|
Macomb County, Michigan |
2.49 |
|
Hillsborough County, New Hampshire |
2.47 |
|
Pettis County, Missouri |
2.46 |
|
Kent County, Rhode Island |
2.44 |
|
Baldwin County, Alabama |
2.42 |
|
Houston County, Alabama |
2.38 |
|
Deschutes County, Oregon |
2.35 |
|
Washington County, Minnesota |
2.34 |
|
Unknown Or Undefined, Kentucky |
2.33 |
|
Clark County, Nevada |
2.25 |
|
Lancaster County, Pennsylvania |
2.2 |
|
Morris County, New Jersey |
2.19 |
|
Medina County, Ohio |
2.17 |
|
Dakota County, Minnesota |
2.11 |
|
Suffolk County, New York |
2.1 |
|
Rock County, Wisconsin |
2.08 |
|
Yavapai County, Arizona |
2.06 |
|
Merrimack County, New Hampshire |
2.04 |
|
Anderson County, South Carolina |
2.01 |
|
Hampden County, Massachusetts |
1.99 |
|
Salt Lake County, Utah |
1.95 |
|
Virginia Beach City, Virginia |
1.95 |
|
Kootenai County, Idaho |
1.92 |
|
Gadsden County, Florida |
1.91 |
|
Douglas County, Georgia |
1.91 |
|
Boulder County, Colorado |
1.9 |
|
Coconino County, Arizona |
1.88 |
|
Wayne County, West Virginia |
1.88 |
|
Douglas County, Minnesota |
1.86 |
|
Gladwin County, Michigan |
1.84 |
|
Westchester County, New York |
1.82 |
|
Johnson County, Texas |
1.81 |
|
Richland County, South Carolina |
1.8 |
|
Alamance County, North Carolina |
1.79 |
|
Denton County, Texas |
1.79 |
|
Washington County, Utah |
1.79 |
|
Riverside County, California |
1.78 |
|
York County, Pennsylvania |
1.77 |
|
Waukesha County, Wisconsin |
1.77 |
|
Linn County, Oregon |
1.76 |
|
Sedgwick County, Kansas |
1.74 |
|
Skagit County, Washington |
1.73 |
|
Brown County, Wisconsin |
1.72 |
|
King County, Washington |
1.71 |
|
Jefferson County, Alabama |
1.7 |
|
Mariposa County, California |
1.69 |
|
San Diego County, California |
1.68 |
|
Gunnison County, Colorado |
1.68 |
|
Canyon County, Idaho |
1.67 |
|
Summit County, Ohio |
1.67 |
|
Dinwiddie County, Virginia |
1.67 |
|
Antrim County, Michigan |
1.66 |
|
Santa Barbara County, California |
1.65 |
|
Mason County, Michigan |
1.65 |
|
Clark County, Arkansas |
1.64 |
|
Pinellas County, Florida |
1.64 |
|
Ulster County, New York |
1.62 |
|
Palo Pinto County, Texas |
1.61 |
|
Essex County, Massachusetts |
1.59 |
|
Lane County, Oregon |
1.59 |
|
Orange County, New York |
1.57 |
|
Bucks County, Pennsylvania |
1.56 |
|
Racine County, Wisconsin |
1.56 |
|
Mohave County, Arizona |
1.55 |
|
Menominee County, Michigan |
1.54 |
|
Miller County, Missouri |
1.54 |
|
Santa Cruz County, California |
1.53 |
|
Clay County, Iowa |
1.53 |
|
Geauga County, Ohio |
1.53 |
|
Utah County, Utah |
1.53 |
|
Hamilton County, Tennessee |
1.51 |
|
El Dorado County, California |
1.5 |
|
Bergen County, New Jersey |
1.49 |
|
Nevada County, California |
1.48 |
|
Shelby County, Ohio |
1.48 |
|
Sarasota County, Florida |
1.47 |
|
St. Clair County, Michigan |
1.47 |
|
Marshall County, Mississippi |
1.46 |
|
Madison County, Indiana |
1.44 |
|
Cook County, Illinois |
1.43 |
|
Ozaukee County, Wisconsin |
1.42 |
|
Oakland County, Michigan |
1.39 |
|
Queens County, New York |
1.39 |
|
Erie County, New York |
1.38 |
|
Wyandotte County, Kansas |
1.37 |
|
Bernalillo County, New Mexico |
1.37 |
|
Niagara County, New York |
1.37 |
|
Orange County, California |
1.33 |
|
Platte County, Nebraska |
1.33 |
|
Floyd County, Indiana |
1.32 |
|
Androscoggin County, Maine |
1.29 |
|
Spartanburg County, South Carolina |
1.29 |
|
Montgomery County, Pennsylvania |
1.28 |
|
Gregg County, Texas |
1.25 |
|
Washtenaw County, Michigan |
1.24 |
|
Jefferson County, Ohio |
1.24 |
|
Washington County, Virginia |
1.24 |
|
DuPage County, Illinois |
1.23 |
|
Dakota County, Nebraska |
1.23 |
|
Stark County, Ohio |
1.23 |
|
Chittenden County, Vermont |
1.23 |
|
Jefferson County, Missouri |
1.22 |
|
Los Angeles County, California |
1.21 |
|
McLean County, Illinois |
1.2 |
|
Eau Claire County, Wisconsin |
1.2 |
|
Milwaukee County, Wisconsin |
1.2 |
|
DeSoto County, Mississippi |
1.19 |
|
Grenada County, Mississippi |
1.19 |
|
Kings County, New York |
1.19 |
|
Holmes County, Ohio |
1.19 |
|
Bonner County, Idaho |
1.18 |
|
Lincoln Parish, Louisiana |
1.18 |
|
Snohomish County, Washington |
1.18 |
|
Teton County, Idaho |
1.17 |
|
Kendall County, Illinois |
1.17 |
|
Fayette County, Kentucky |
1.17 |
|
Elk County, Pennsylvania |
1.16 |
|
Martin County, Florida |
1.15 |
|
Hamilton County, Indiana |
1.15 |
|
Boone County, Kentucky |
1.15 |
|
Union County, New Jersey |
1.15 |
|
Travis County, Texas |
1.15 |
|
Shelby County, Alabama |
1.14 |
|
San Luis Obispo County, California |
1.14 |
|
Unknown Or Undefined, Idaho |
1.14 |
|
Multnomah County, Oregon |
1.14 |
|
Roanoke City, Virginia |
1.14 |
|
Middlesex County, Connecticut |
1.13 |
|
Passaic County, New Jersey |
1.13 |
|
Oklahoma County, Oklahoma |
1.13 |
|
Kitsap County, Washington |
1.13 |
|
Johnson County, Kansas |
1.12 |
|
Craven County, North Carolina |
1.12 |
|
Charlottesville City, Virginia |
1.11 |
|
Lehigh County, Pennsylvania |
1.1 |
|
Bell County, Texas |
1.1 |
|
Chesterfield County, Virginia |
1.1 |
|
East Baton Rouge Parish, Louisiana |
1.09 |
|
Clackamas County, Oregon |
1.09 |
|
Butte County, California |
1.08 |
|
San Bernardino County, California |
1.08 |
|
Solano County, California |
1.08 |
|
Jackson County, Oregon |
1.08 |
|
El Paso County, Colorado |
1.07 |
|
Brevard County, Florida |
1.07 |
|
New Haven County, Connecticut |
1.06 |
|
Gwinnett County, Georgia |
1.06 |
|
Guilford County, North Carolina |
1.06 |
|
Augusta County, Virginia |
1.06 |
|
Lincoln County, Maine |
1.05 |
|
Kent County, Michigan |
1.05 |
|
Chemung County, New York |
1.05 |
|
Ashtabula County, Ohio |
1.05 |
|
Humboldt County, California |
1.04 |
|
Lebanon County, Pennsylvania |
1.04 |
|
Davidson County, Tennessee |
1.04 |
|
Smith County, Texas |
1.04 |
|
Whatcom County, Washington |
1.04 |
|
Seminole County, Florida |
1.03 |
|
Bartow County, Georgia |
1.03 |
|
Volusia County, Florida |
1.02 |
|
Washington County, Oregon |
1.02 |
|
Fort Bend County, Texas |
1.02 |
|
Alachua County, Florida |
1.01 |
|
St. Joseph County, Indiana |
1.01 |
|
Norfolk County, Massachusetts |
1.01 |
|
Lexington County, South Carolina |
1.01 |
|
Marathon County, Wisconsin |
1.01 |
|
DeKalb County, Georgia |
1 |
|
Polk County, Florida |
0.98 |
|
St. Charles County, Missouri |
0.98 |
|
Charleston County, South Carolina |
0.98 |
|
Hays County, Texas |
0.98 |
|
Tarrant County, Texas |
0.97 |
|
Greene County, Missouri |
0.96 |
|
Burlington County, New Jersey |
0.96 |
|
Larimer County, Colorado |
0.95 |
|
Vanderburgh County, Indiana |
0.95 |
|
Missoula County, Montana |
0.94 |
|
Ventura County, California |
0.92 |
|
St. Clair County, Illinois |
0.91 |
|
Clay County, Missouri |
0.91 |
|
Craighead County, Arkansas |
0.9 |
|
Denver County, Colorado |
0.9 |
|
Onondaga County, New York |
0.9 |
|
Webster County, Missouri |
0.89 |
|
New Hanover County, North Carolina |
0.89 |
|
Erie County, Pennsylvania |
0.89 |
|
Unknown Or Undefined, South Carolina |
0.89 |
|
Wharton County, Texas |
0.89 |
|
Unknown Or Undefined, Minnesota |
0.87 |
|
Carson City, Nevada |
0.87 |
|
New York County, New York |
0.87 |
|
Kenosha County, Wisconsin |
0.87 |
|
Gloucester County, New Jersey |
0.86 |
|
Hamilton County, Ohio |
0.86 |
|
Delaware County, Pennsylvania |
0.86 |
|
Harris County, Texas |
0.86 |
|
Tooele County, Utah |
0.86 |
|
Cascade County, Montana |
0.85 |
|
Allen County, Ohio |
0.85 |
|
Montgomery County, Texas |
0.85 |
|
Pima County, Arizona |
0.84 |
|
Alameda County, California |
0.84 |
|
Will County, Illinois |
0.84 |
|
Chautauqua County, New York |
0.84 |
|
Bay County, Florida |
0.83 |
|
Ada County, Idaho |
0.83 |
|
Marion County, Indiana |
0.83 |
|
Santa Fe County, New Mexico |
0.83 |
|
Washington County, Rhode Island |
0.83 |
|
Lake County, Florida |
0.82 |
|
Pasco County, Florida |
0.82 |
|
Davidson County, North Carolina |
0.82 |
|
Douglas County, Kansas |
0.81 |
|
Montcalm County, Michigan |
0.81 |
|
Franklin County, Ohio |
0.81 |
|
Greenville County, South Carolina |
0.81 |
|
Yakima County, Washington |
0.81 |
|
Maricopa County, Arizona |
0.8 |
|
Unknown Or Undefined, Illinois |
0.8 |
|
Oxford County, Maine |
0.8 |
|
Carroll County, Maryland |
0.8 |
|
Lewis and Clark County, Montana |
0.8 |
|
Tulsa County, Oklahoma |
0.8 |
|
Washington County, Arkansas |
0.79 |
|
Sonoma County, California |
0.79 |
|
Campbell County, Kentucky |
0.79 |
|
Penobscot County, Maine |
0.78 |
|
Middlesex County, Massachusetts |
0.78 |
|
Winnebago County, Illinois |
0.77 |
|
Hancock County, Maine |
0.77 |
|
Calhoun County, Michigan |
0.77 |
|
Saginaw County, Michigan |
0.77 |
|
Unknown Or Undefined, Oklahoma |
0.77 |
|
Mesa County, Colorado |
0.76 |
|
Ouachita Parish, Louisiana |
0.76 |
|
El Paso County, Texas |
0.76 |
|
Black Hawk County, Iowa |
0.75 |
|
Hennepin County, Minnesota |
0.75 |
|
Sussex County, New Jersey |
0.75 |
|
Catawba County, North Carolina |
0.75 |
|
Wayne County, Pennsylvania |
0.75 |
|
Rockingham County, Virginia |
0.75 |
|
Monroe County, Indiana |
0.74 |
|
Freeborn County, Minnesota |
0.74 |
|
Camden County, New Jersey |
0.74 |
|
McHenry County, Illinois |
0.73 |
|
Story County, Iowa |
0.73 |
|
Ottawa County, Michigan |
0.73 |
|
McLennan County, Texas |
0.73 |
|
Jefferson County, Colorado |
0.72 |
|
Jefferson County, Kentucky |
0.72 |
|
Pulaski County, Kentucky |
0.72 |
|
Madison County, Mississippi |
0.71 |
|
Rockingham County, New Hampshire |
0.71 |
|
Mecklenburg County, North Carolina |
0.71 |
|
Lucas County, Ohio |
0.71 |
|
Bryan County, Oklahoma |
0.71 |
|
Luzerne County, Pennsylvania |
0.71 |
|
Miami-Dade County, Florida |
0.7 |
|
Warren County, New Jersey |
0.7 |
|
Calcasieu Parish, Louisiana |
0.69 |
|
Polk County, Missouri |
0.69 |
|
Yellowstone County, Montana |
0.69 |
|
Forsyth County, North Carolina |
0.69 |
|
Bexar County, Texas |
0.68 |
|
Orleans Parish, Louisiana |
0.67 |
|
Livingston County, Michigan |
0.67 |
|
Ramsey County, Minnesota |
0.67 |
|
Dutchess County, New York |
0.67 |
|
Butler County, Ohio |
0.67 |
|
Dallas County, Texas |
0.67 |
|
St. Mary Parish, Louisiana |
0.66 |
|
Schoharie County, New York |
0.66 |
|
Chester County, South Carolina |
0.66 |
|
Allegheny County, Pennsylvania |
0.65 |
|
Midland County, Texas |
0.65 |
|
Wasatch County, Utah |
0.65 |
|
Greene County, Arkansas |
0.64 |
|
Franklin County, Kentucky |
0.64 |
|
Harford County, Maryland |
0.64 |
|
Lackawanna County, Pennsylvania |
0.64 |
|
Susquehanna County, Pennsylvania |
0.64 |
|
La Crosse County, Wisconsin |
0.64 |
|
Linn County, Iowa |
0.63 |
|
Anne Arundel County, Maryland |
0.63 |
|
Barry County, Michigan |
0.63 |
|
Cuyahoga County, Ohio |
0.63 |
|
Horry County, South Carolina |
0.63 |
|
Hidalgo County, Texas |
0.63 |
|
Iroquois County, Illinois |
0.62 |
|
Plymouth County, Massachusetts |
0.62 |
|
Cape Girardeau County, Missouri |
0.62 |
|
St. Louis City, Missouri |
0.62 |
|
Wood County, Ohio |
0.62 |
|
Chester County, Pennsylvania |
0.62 |
|
Westmoreland County, Pennsylvania |
0.62 |
|
Charlotte County, Florida |
0.61 |
|
Mahoning County, Ohio |
0.61 |
|
Berks County, Pennsylvania |
0.61 |
|
Palm Beach County, Florida |
0.6 |
|
Honolulu County, Hawaii |
0.6 |
|
Grand Traverse County, Michigan |
0.6 |
|
Rogers County, Oklahoma |
0.6 |
|
Ellis County, Texas |
0.6 |
|
Henrico County, Virginia |
0.6 |
|
Pierce County, Washington |
0.6 |
|
Lewis County, West Virginia |
0.6 |
|
Bayamon Municipio, Puerto Rico |
0.6 |
|
Calhoun County, Alabama |
0.59 |
|
Duval County, Florida |
0.59 |
|
Hall County, Georgia |
0.59 |
|
Nueces County, Texas |
0.59 |
|
Danville City, Virginia |
0.59 |
|
Unknown Or Undefined, California |
0.58 |
|
Broward County, Florida |
0.58 |
|
Lake County, Indiana |
0.58 |
|
Wayne County, Michigan |
0.58 |
|
Buncombe County, North Carolina |
0.58 |
|
Coos County, Oregon |
0.58 |
|
Hood County, Texas |
0.58 |
|
Washington County, Wisconsin |
0.58 |
|
Shasta County, California |
0.57 |
|
Fairfield County, Connecticut |
0.57 |
|
Clay County, Florida |
0.57 |
|
Manatee County, Florida |
0.57 |
|
Hartford County, Connecticut |
0.56 |
|
Livingston Parish, Louisiana |
0.56 |
|
Marion County, Oregon |
0.56 |
|
Lee County, Florida |
0.55 |
|
Douglas County, Nebraska |
0.55 |
|
Tompkins County, New York |
0.55 |
|
Genesee County, Michigan |
0.54 |
|
Lancaster County, Nebraska |
0.54 |
|
Cleveland County, Oklahoma |
0.54 |
|
Porter County, Indiana |
0.53 |
|
Aitkin County, Minnesota |
0.53 |
|
San Juan County, New Mexico |
0.53 |
|
Summit County, Utah |
0.53 |
|
St. Lucie County, Florida |
0.52 |
|
St. Tammany Parish, Louisiana |
0.52 |
|
Worcester County, Massachusetts |
0.52 |
|
Middlesex County, New Jersey |
0.52 |
|
Rutherford County, North Carolina |
0.52 |
|
Hillsborough County, Florida |
0.51 |
|
Prince George's County, Maryland |
0.51 |
|
San Juan Municipio, Puerto Rico |
0.51 |
|
Somerset County, Maine |
0.5 |
|
Butler County, Pennsylvania |
0.5 |
|
Clark County, Washington |
0.5 |
|
Iberia Parish, Louisiana |
0.49 |
|
Knox County, Maine |
0.49 |
|
Monmouth County, New Jersey |
0.49 |
|
Cass County, North Dakota |
0.49 |
|
Montgomery County, Ohio |
0.49 |
|
New London County, Connecticut |
0.48 |
|
Escambia County, Florida |
0.48 |
|
Nassau County, New York |
0.48 |
|
Pitt County, North Carolina |
0.48 |
|
Philadelphia County, Pennsylvania |
0.48 |
|
Rockwall County, Texas |
0.48 |
|
Lewis County, Washington |
0.48 |
|
Spokane County, Washington |
0.48 |
|
Thurston County, Washington |
0.48 |
|
Bossier Parish, Louisiana |
0.47 |
|
Terrebonne Parish, Louisiana |
0.47 |
|
Lawrence County, South Dakota |
0.47 |
|
St. Johns County, Florida |
0.46 |
|
Fayette County, Georgia |
0.46 |
|
Lawrence County, Indiana |
0.46 |
|
Stearns County, Minnesota |
0.46 |
|
Jackson County, Missouri |
0.46 |
|
Hudson County, New Jersey |
0.46 |
|
Collin County, Texas |
0.46 |
|
Salem City, Virginia |
0.46 |
|
Arapahoe County, Colorado |
0.45 |
|
Forsyth County, Georgia |
0.45 |
|
Albany County, New York |
0.45 |
|
Crawford County, Pennsylvania |
0.45 |
|
Roanoke County, Virginia |
0.45 |
|
Natrona County, Wyoming |
0.45 |
|
Pulaski County, Arkansas |
0.44 |
|
Weld County, Colorado |
0.44 |
|
LaPorte County, Indiana |
0.44 |
|
Wasco County, Oregon |
0.44 |
|
Williamson County, Texas |
0.44 |
|
Frederick County, Maryland |
0.43 |
|
Berrien County, Michigan |
0.43 |
|
Ocean County, New Jersey |
0.43 |
|
Rensselaer County, New York |
0.43 |
|
Clinton County, Ohio |
0.43 |
|
Outagamie County, Wisconsin |
0.43 |
|
Cherokee County, Georgia |
0.42 |
|
Whitfield County, Georgia |
0.42 |
|
Caddo Parish, Louisiana |
0.42 |
|
Dodge County, Minnesota |
0.42 |
|
Essex County, New Jersey |
0.42 |
|
Bronx County, New York |
0.42 |
|
Trumbull County, Ohio |
0.42 |
|
Sacramento County, California |
0.41 |
|
Howard County, Maryland |
0.41 |
|
Baltimore City, Maryland |
0.41 |
|
St. Louis County, Missouri |
0.41 |
|
Cumberland County, Pennsylvania |
0.41 |
|
Mercer County, Pennsylvania |
0.41 |
|
Lubbock County, Texas |
0.41 |
|
Santa Clara County, California |
0.4 |
|
Fulton County, Georgia |
0.4 |
|
Baltimore County, Maryland |
0.4 |
|
Olmsted County, Minnesota |
0.4 |
|
Monroe County, New York |
0.4 |
|
Henderson County, Texas |
0.4 |
|
Charlevoix County, Michigan |
0.39 |
|
Le Sueur County, Minnesota |
0.39 |
|
Dona Ana County, New Mexico |
0.39 |
|
Unknown Or Undefined, New Mexico |
0.39 |
|
Oneida County, New York |
0.39 |
|
Schenectady County, New York |
0.39 |
|
Knox County, Tennessee |
0.39 |
|
Fauquier County, Virginia |
0.39 |
|
Chesapeake City, Virginia |
0.39 |
|
Dunn County, Wisconsin |
0.39 |
|
Fresno County, California |
0.38 |
|
Okaloosa County, Florida |
0.38 |
|
Orange County, Florida |
0.38 |
|
Hardin County, Kentucky |
0.38 |
|
Warren County, Kentucky |
0.38 |
|
Muskogee County, Oklahoma |
0.38 |
|
Taylor County, Texas |
0.38 |
|
Dane County, Wisconsin |
0.38 |
|
Sawyer County, Wisconsin |
0.38 |
|
Polk County, Iowa |
0.37 |
|
Jefferson Parish, Louisiana |
0.37 |
|
Burleigh County, North Dakota |
0.37 |
|
San Joaquin County, California |
0.36 |
|
Clarke County, Georgia |
0.36 |
|
Sangamon County, Illinois |
0.36 |
|
Hendricks County, Indiana |
0.36 |
|
Tippecanoe County, Indiana |
0.36 |
|
Scott County, Iowa |
0.36 |
|
Perry County, Missouri |
0.36 |
|
Potter County, Texas |
0.36 |
|
Johnson County, Arkansas |
0.35 |
|
Douglas County, Colorado |
0.35 |
|
Shelby County, Tennessee |
0.35 |
|
Stanislaus County, California |
0.34 |
|
Unknown Or Undefined, Florida |
0.34 |
|
Placer County, California |
0.33 |
|
Jackson County, Michigan |
0.33 |
|
Warren County, New York |
0.33 |
|
Contra Costa County, California |
0.32 |
|
Cobb County, Georgia |
0.32 |
|
Buena Vista County, Iowa |
0.32 |
|
Cumberland County, Maine |
0.32 |
|
Flathead County, Montana |
0.32 |
|
Sumter County, South Carolina |
0.32 |
|
Monterey County, California |
0.31 |
|
Adams County, Colorado |
0.31 |
|
Parker County, Texas |
0.31 |
|
Osceola County, Florida |
0.3 |
|
Ingham County, Michigan |
0.3 |
|
Marquette County, Michigan |
0.3 |
|
Somerset County, New Jersey |
0.3 |
|
Williamson County, Tennessee |
0.3 |
|
San Mateo County, California |
0.29 |
|
Marion County, Florida |
0.29 |
|
Washington County, Pennsylvania |
0.29 |
|
Brazos County, Texas |
0.29 |
|
Prince William County, Virginia |
0.29 |
|
Hopkins County, Kentucky |
0.28 |
|
St. Mary's County, Maryland |
0.28 |
|
Buffalo County, Nebraska |
0.28 |
|
Wake County, North Carolina |
0.28 |
|
Franklin County, Pennsylvania |
0.28 |
|
Walker County, Alabama |
0.27 |
|
San Francisco County, California |
0.27 |
|
Yolo County, California |
0.27 |
|
Eaton County, Michigan |
0.27 |
|
Hinds County, Mississippi |
0.27 |
|
Henderson County, North Carolina |
0.27 |
|
Comanche County, Oklahoma |
0.27 |
|
Faulkner County, Arkansas |
0.26 |
|
Coweta County, Georgia |
0.26 |
|
Anchorage Borough, Alaska |
0.25 |
|
Ionia County, Michigan |
0.25 |
|
Durham County, North Carolina |
0.25 |
|
Delta County, Colorado |
0.24 |
|
Bonneville County, Idaho |
0.24 |
|
Harrison County, Mississippi |
0.24 |
|
Richmond County, New York |
0.24 |
|
Rockland County, New York |
0.24 |
|
Steuben County, New York |
0.24 |
|
Orange County, North Carolina |
0.24 |
|
Madison County, Tennessee |
0.24 |
|
Mobile County, Alabama |
0.23 |
|
Santa Rosa County, Florida |
0.23 |
|
Madison County, Illinois |
0.23 |
|
Onslow County, North Carolina |
0.23 |
|
Unknown Or Undefined, Virginia |
0.23 |
|
Chatham County, Georgia |
0.22 |
|
Vigo County, Indiana |
0.22 |
|
Monroe County, Michigan |
0.22 |
|
Richmond City, Virginia |
0.22 |
|
Hawaii County, Hawaii |
0.21 |
|
St. Louis County, Minnesota |
0.21 |
|
Loudoun County, Virginia |
0.21 |
|
Montgomery County, Alabama |
0.2 |
|
Broome County, New York |
0.2 |
|
Cameron County, Texas |
0.2 |
|
Alexandria City, Virginia |
0.2 |
|
Garland County, Arkansas |
0.19 |
|
Kern County, California |
0.19 |
|
Auglaize County, Ohio |
0.19 |
|
Beaufort County, South Carolina |
0.19 |
|
Jefferson County, Texas |
0.19 |
|
Wichita County, Texas |
0.19 |
|
Franklin County, Washington |
0.19 |
|
Talladega County, Alabama |
0.18 |
|
Pueblo County, Colorado |
0.18 |
|
Floyd County, Georgia |
0.18 |
|
Cumberland County, North Carolina |
0.18 |
|
Polk County, Oregon |
0.18 |
|
Marin County, California |
0.17 |
|
Rockdale County, Georgia |
0.17 |
|
Barnstable County, Massachusetts |
0.17 |
|
Bay County, Michigan |
0.17 |
|
Richland County, Ohio |
0.17 |
|
Fairfax County, Virginia |
0.17 |
|
Tulare County, California |
0.16 |
|
Leon County, Florida |
0.16 |
|
Hunterdon County, New Jersey |
0.16 |
|
Montgomery County, Tennessee |
0.16 |
|
Brown County, Texas |
0.16 |
|
Randall County, Texas |
0.15 |
|
Manassas City, Virginia |
0.15 |
|
Madison County, Alabama |
0.14 |
|
Kenton County, Kentucky |
0.14 |
|
Laramie County, Wyoming |
0.14 |
|
Mendocino County, California |
0.13 |
|
Kennebec County, Maine |
0.13 |
|
Lenawee County, Michigan |
0.13 |
|
Moore County, North Carolina |
0.13 |
|
Guadalupe County, Texas |
0.13 |
|
Shawnee County, Kansas |
0.12 |
|
Cheshire County, New Hampshire |
0.12 |
|
Dauphin County, Pennsylvania |
0.12 |
|
Napa County, California |
0.11 |
|
Houston County, Georgia |
0.11 |
|
Kosciusko County, Indiana |
0.11 |
|
Montgomery County, Maryland |
0.11 |
|
Wicomico County, Maryland |
0.11 |
|
Jackson County, Mississippi |
0.11 |
|
Mercer County, New Jersey |
0.11 |
|
Unknown Or Undefined, Tennessee |
0.11 |
|
Unknown Or Undefined, Texas |
0.11 |
|
Norfolk City, Virginia |
0.11 |
|
Benton County, Washington |
0.11 |
|
Atlantic County, New Jersey |
0.09 |
|
Unknown Or Undefined, North Carolina |
0.09 |
|
Frederick County, Virginia |
0.09 |
|
Unknown Or Undefined, Alabama |
0.08 |
|
Sumter County, Florida |
0.08 |
|
Peoria County, Illinois |
0.07 |
|
Aroostook County, Maine |
0.07 |
|
Unknown Or Undefined, Georgia |
0.06 |
|
Boone County, Missouri |
0.06 |
|
Oconee County, South Carolina |
0.06 |
|
Unknown Or Undefined, Ohio |
0.05 |
|
Unknown Or Undefined, Missouri |
0.04 |
|
Unknown Or Undefined, New York |
0.04 |
|
Arlington County, Virginia |
0.04 |
|
Unknown Or Undefined, Indiana |
0.03 |
|
Unknown Or Undefined, Maryland |
0.03 |
|
Source: U.S. Bureau of Labor Statistics, Quarterly Census of Employment and Wages. |
|
| Occupation | Percent of occupation in other miscellaneous manufacturing | Total employment | Employment in other miscellaneous manufacturing |
|---|---|---|---|
| Jewelers and precious stone and metal workers | 28.3 | 25,270 | 7,160 |
| Etchers and engravers | 15.8 | 9,490 | 1,500 |
| Painting, coating, and decorating workers | 14.3 | 16,020 | 2,290 |
| Source: U.S. Bureau of Labor Statistics, Occupational Employment Statistics. | |||
| Area | Location quotient |
|---|---|
|
North and West Central New Mexico nonmetropolitan area |
11.44 |
|
Rapid City, South Dakota |
8.79 |
|
Providence-Warwick, RI-MA |
8.31 |
|
Southern Vermont nonmetropolitan area |
6.93 |
|
New York-Jersey City-White Plains, NY-NJ Metropolitan Division |
4.75 |
|
Sebastian-Vero Beach, Florida |
3.70 |
|
Santa Fe, New Mexico |
3.48 |
|
Albuquerque, New Mexico |
2.63 |
|
Southeast Minnesota nonmetropolitan area |
2.42 |
|
Santa Cruz-Watsonville, California |
2.40 |
| Source: U.S. Bureau of Labor Statistics, Occupational Employment Statistics. | |
Note: The North American Industry Classification System groups this industry under “nonmetallic mineral mining and quarrying.”
| County | Location quotient |
|---|---|
|
Talbot County, Georgia |
180.39 |
|
Big Horn County, Wyoming |
176.27 |
|
Johnston County, Oklahoma |
98.39 |
|
Oglethorpe County, Georgia |
83.77 |
|
Iron County, Missouri |
71.67 |
|
Eddy County, New Mexico |
69.52 |
|
Ste. Genevieve County, Missouri |
62.96 |
|
Susquehanna County, Pennsylvania |
58.27 |
|
Elbert County, Georgia |
51.89 |
|
San Saba County, Texas |
37.6 |
| Source: U.S. Bureau of Labor Statistics, Quarterly Census of Employment and Wages. | |

| County | Location quotient |
|---|---|
|
Talbot County, Georgia |
180.39 |
|
Big Horn County, Wyoming |
176.27 |
|
Johnston County, Oklahoma |
98.39 |
|
Oglethorpe County, Georgia |
83.77 |
|
Iron County, Missouri |
71.67 |
|
Eddy County, New Mexico |
69.52 |
|
Ste. Genevieve County, Missouri |
62.96 |
|
Susquehanna County, Pennsylvania |
58.27 |
|
Elbert County, Georgia |
51.89 |
|
San Saba County, Texas |
37.6 |
|
Eddy County, North Dakota |
34.96 |
|
Juab County, Utah |
34.37 |
|
Jackson County, Wisconsin |
33.81 |
|
Hood County, Texas |
31.4 |
|
Conejos County, Colorado |
29.96 |
|
Sevier County, Utah |
28.68 |
|
Juana Diaz Municipio, Puerto Rico |
26.42 |
|
King William County, Virginia |
24.52 |
|
Weakley County, Tennessee |
21.3 |
|
Lyon County, Nevada |
20.88 |
|
Rutland County, Vermont |
19.51 |
|
Le Flore County, Oklahoma |
19.5 |
|
Cassia County, Idaho |
19.2 |
|
Calumet County, Wisconsin |
18.71 |
|
Chippewa County, Wisconsin |
18.65 |
|
Logan County, Arkansas |
17.99 |
|
Elko County, Nevada |
17.29 |
|
Madison County, Iowa |
16.54 |
|
Meigs County, Ohio |
15.03 |
|
Copiah County, Mississippi |
14.34 |
|
Washakie County, Wyoming |
14.08 |
|
Essex County, New York |
13.86 |
|
Clark County, Illinois |
13.77 |
|
Franklin County, Alabama |
13.72 |
|
Barron County, Wisconsin |
13.5 |
|
Lawrence County, Arkansas |
13.46 |
|
Worth County, Iowa |
13.26 |
|
Comal County, Texas |
13.26 |
|
Delaware County, New York |
13.07 |
|
East Feliciana Parish, Louisiana |
12.86 |
|
Lincoln County, Missouri |
12.4 |
|
Murray County, Minnesota |
12.19 |
|
Washington County, New York |
11.31 |
|
Marshall County, Illinois |
10.47 |
|
Adams County, Illinois |
10.32 |
|
Grant County, South Dakota |
10.32 |
|
Montgomery County, Missouri |
10.29 |
|
Autauga County, Alabama |
10.25 |
|
Benton County, Tennessee |
10.01 |
|
Fayette County, Texas |
9.88 |
|
Sanilac County, Michigan |
9.53 |
|
Dade County, Missouri |
9.11 |
|
Franklin County, Tennessee |
8.97 |
|
Hill County, Texas |
8.89 |
|
McDowell County, North Carolina |
8.88 |
|
Ward County, North Dakota |
8.82 |
|
Pacific County, Washington |
8.67 |
|
Caddo County, Oklahoma |
8.64 |
|
Armstrong County, Pennsylvania |
8.56 |
|
Jackson County, Florida |
8.46 |
|
Kanabec County, Minnesota |
8.16 |
|
Fayette County, Pennsylvania |
8.05 |
|
Millard County, Utah |
8.04 |
|
Miami County, Indiana |
7.7 |
|
Lewis County, Washington |
7.66 |
|
Taos County, New Mexico |
7.46 |
|
Osage County, Missouri |
7.28 |
|
Polk County, Wisconsin |
6.89 |
|
Wise County, Texas |
6.78 |
|
Culpeper County, Virginia |
6.47 |
|
Fremont County, Colorado |
6.34 |
|
Callaway County, Missouri |
6.25 |
|
Lapeer County, Michigan |
6.11 |
|
Rowan County, North Carolina |
6.03 |
|
Livingston Parish, Louisiana |
6 |
|
Holt County, Nebraska |
6 |
|
Sullivan County, New York |
5.89 |
|
Ouachita County, Arkansas |
5.82 |
|
Liberty County, Texas |
5.82 |
|
Baxter County, Arkansas |
5.76 |
|
Aguada Municipio, Puerto Rico |
5.69 |
|
Shelby County, Indiana |
5.63 |
|
Becker County, Minnesota |
5.62 |
|
Muskingum County, Ohio |
5.56 |
|
Burnet County, Texas |
5.55 |
|
Levy County, Florida |
5.54 |
|
Jefferson County, Nebraska |
5.48 |
|
San Patricio County, Texas |
5.45 |
|
Franklin County, Indiana |
5.3 |
|
Webster County, Missouri |
5.24 |
|
Parker County, Texas |
5.16 |
|
Gallatin County, Montana |
5.11 |
|
Monroe County, Indiana |
5.07 |
|
Morgan County, Indiana |
5.04 |
|
Fond Du Lac County, Wisconsin |
5.04 |
|
Orleans County, New York |
4.97 |
|
Potter County, Pennsylvania |
4.96 |
|
Wagoner County, Oklahoma |
4.92 |
|
Cecil County, Maryland |
4.53 |
|
Sanpete County, Utah |
4.52 |
|
Iosco County, Michigan |
4.51 |
|
Warren County, New York |
4.47 |
|
Cabo Rojo Municipio, Puerto Rico |
4.4 |
|
Jefferson County, Missouri |
4.32 |
|
Gillespie County, Texas |
4.22 |
|
Love County, Oklahoma |
4.19 |
|
Duchesne County, Utah |
4.17 |
|
Sandoval County, New Mexico |
4.14 |
|
Sussex County, New Jersey |
4.13 |
|
Lawrence County, Pennsylvania |
4.04 |
|
Logan County, West Virginia |
4.03 |
|
DeKalb County, Indiana |
3.96 |
|
Ripley County, Indiana |
3.89 |
|
Greene County, Georgia |
3.75 |
|
Navajo County, Arizona |
3.72 |
|
Sioux County, Iowa |
3.66 |
|
Yamhill County, Oregon |
3.58 |
|
Greene County, Indiana |
3.55 |
|
Mercer County, North Dakota |
3.53 |
|
Bureau County, Illinois |
3.49 |
|
Cumberland County, New Jersey |
3.48 |
|
West Feliciana Parish, Louisiana |
3.44 |
|
Medina County, Texas |
3.43 |
|
Cattaraugus County, New York |
3.38 |
|
Bell County, Texas |
3.38 |
|
Chippewa County, Michigan |
3.36 |
|
Belmont County, Ohio |
3.36 |
|
Lee County, North Carolina |
3.28 |
|
Allamakee County, Iowa |
3.26 |
|
Herkimer County, New York |
3.24 |
|
Suwannee County, Florida |
3.14 |
|
Pulaski County, Arkansas |
3.04 |
|
Barry County, Missouri |
3.02 |
|
Matanuska-Susitna Borough, Alaska |
2.98 |
|
Polk County, Minnesota |
2.98 |
|
McDuffie County, Georgia |
2.95 |
|
Atascosa County, Texas |
2.86 |
|
Oswego County, New York |
2.83 |
|
Dutchess County, New York |
2.79 |
|
Russell County, Alabama |
2.74 |
|
Meeker County, Minnesota |
2.73 |
|
Logan County, Ohio |
2.69 |
|
Howard County, Texas |
2.62 |
|
Larimer County, Colorado |
2.59 |
|
Washington County, Rhode Island |
2.56 |
|
Kay County, Oklahoma |
2.53 |
|
Scott County, Minnesota |
2.5 |
|
Steuben County, New York |
2.49 |
|
Pembina County, North Dakota |
2.48 |
|
Canadian County, Oklahoma |
2.47 |
|
Windsor County, Vermont |
2.46 |
|
Buffalo County, Nebraska |
2.45 |
|
Ulster County, New York |
2.4 |
|
Garfield County, Colorado |
2.38 |
|
Franklin County, Vermont |
2.37 |
|
Franklin County, Missouri |
2.36 |
|
Rice County, Minnesota |
2.32 |
|
Putnam County, Tennessee |
2.31 |
|
Gila County, Arizona |
2.27 |
|
Butler County, Pennsylvania |
2.26 |
|
Yavapai County, Arizona |
2.17 |
|
Orange County, Vermont |
2.17 |
|
Weld County, Colorado |
2.12 |
|
McLennan County, Texas |
2.1 |
|
Litchfield County, Connecticut |
2.09 |
|
Cape Girardeau County, Missouri |
2.08 |
|
Oneida County, New York |
2.06 |
|
Marathon County, Wisconsin |
2.03 |
|
St. Lawrence County, New York |
1.93 |
|
Berrien County, Michigan |
1.9 |
|
Hamilton County, Indiana |
1.84 |
|
Beaver County, Pennsylvania |
1.82 |
|
Waukesha County, Wisconsin |
1.82 |
|
Montgomery County, Texas |
1.8 |
|
Craven County, North Carolina |
1.78 |
|
Forsyth County, Georgia |
1.77 |
|
Monroe County, Pennsylvania |
1.75 |
|
Ellis County, Texas |
1.73 |
|
Santa Fe County, New Mexico |
1.72 |
|
Portage County, Ohio |
1.72 |
|
Potter County, Texas |
1.72 |
|
Westmoreland County, Pennsylvania |
1.71 |
|
Smith County, Texas |
1.71 |
|
York County, Maine |
1.69 |
|
Etowah County, Alabama |
1.68 |
|
Guaynabo Municipio, Puerto Rico |
1.66 |
|
Wilson County, Tennessee |
1.65 |
|
Yellowstone County, Montana |
1.63 |
|
Augusta County, Virginia |
1.63 |
|
Lee County, Alabama |
1.61 |
|
Taney County, Missouri |
1.61 |
|
Mercer County, Pennsylvania |
1.59 |
|
Boulder County, Colorado |
1.58 |
|
Cole County, Missouri |
1.57 |
|
Mohave County, Arizona |
1.53 |
|
Whitfield County, Georgia |
1.53 |
|
Luzerne County, Pennsylvania |
1.52 |
|
Lexington County, South Carolina |
1.49 |
|
Madison County, Illinois |
1.46 |
|
Rock Island County, Illinois |
1.44 |
|
Otter Tail County, Minnesota |
1.37 |
|
Lee County, Florida |
1.36 |
|
Eaton County, Michigan |
1.35 |
|
Washington County, Minnesota |
1.33 |
|
Grafton County, New Hampshire |
1.33 |
|
Will County, Illinois |
1.32 |
|
Washington County, Oregon |
1.32 |
|
Phelps County, Missouri |
1.3 |
|
Linn County, Iowa |
1.25 |
|
Wayne County, Michigan |
1.2 |
|
Cowley County, Kansas |
1.19 |
|
Monterey County, California |
1.17 |
|
Wayne County, Indiana |
1.13 |
|
Wayne County, Ohio |
1.13 |
|
Tuscaloosa County, Alabama |
1.12 |
|
Shawnee County, Kansas |
1.1 |
|
Buncombe County, North Carolina |
1.09 |
|
Salt Lake County, Utah |
1.06 |
|
Nueces County, Texas |
1.05 |
|
Marion County, Florida |
1.04 |
|
Oxford County, Maine |
1.01 |
|
Benton County, Oregon |
1.01 |
|
Butte County, California |
0.97 |
|
Clay County, Missouri |
0.91 |
|
Pinal County, Arizona |
0.9 |
|
Dodge County, Nebraska |
0.9 |
|
Ector County, Texas |
0.9 |
|
San Bernardino County, California |
0.88 |
|
Unknown Or Undefined, Idaho |
0.88 |
|
Hall County, Nebraska |
0.88 |
|
Worcester County, Massachusetts |
0.87 |
|
Pierce County, Washington |
0.86 |
|
Cochise County, Arizona |
0.84 |
|
Ponce Municipio, Puerto Rico |
0.84 |
|
Umatilla County, Oregon |
0.83 |
|
Clearfield County, Pennsylvania |
0.82 |
|
Skagit County, Washington |
0.82 |
|
Adams County, Colorado |
0.8 |
|
New Haven County, Connecticut |
0.8 |
|
Allen County, Indiana |
0.8 |
|
New London County, Connecticut |
0.78 |
|
Steuben County, Indiana |
0.78 |
|
Gloucester County, New Jersey |
0.78 |
|
Broome County, New York |
0.78 |
|
Boone County, Missouri |
0.77 |
|
Midland County, Texas |
0.77 |
|
Snohomish County, Washington |
0.75 |
|
Fairbanks North Star Borough, Alaska |
0.74 |
|
Lafayette Parish, Louisiana |
0.74 |
|
Taylor County, Texas |
0.73 |
|
Pasco County, Florida |
0.72 |
|
Livingston County, Michigan |
0.71 |
|
Honolulu County, Hawaii |
0.7 |
|
Allegan County, Michigan |
0.69 |
|
Allegheny County, Pennsylvania |
0.68 |
|
Chester County, Pennsylvania |
0.68 |
|
Chittenden County, Vermont |
0.68 |
|
Brown County, Wisconsin |
0.66 |
|
Peoria County, Illinois |
0.65 |
|
Hawaii County, Hawaii |
0.64 |
|
McHenry County, Illinois |
0.64 |
|
Fresno County, California |
0.62 |
|
Lackawanna County, Pennsylvania |
0.62 |
|
Riverside County, California |
0.61 |
|
Hampden County, Massachusetts |
0.6 |
|
Jefferson County, Alabama |
0.59 |
|
Northampton County, Pennsylvania |
0.59 |
|
Cuyahoga County, Ohio |
0.58 |
|
Fort Bend County, Texas |
0.58 |
|
El Dorado County, California |
0.56 |
|
Lubbock County, Texas |
0.56 |
|
Erie County, Pennsylvania |
0.55 |
|
Harris County, Texas |
0.55 |
|
Racine County, Wisconsin |
0.54 |
|
Craighead County, Arkansas |
0.52 |
|
Knox County, Indiana |
0.52 |
|
Plymouth County, Massachusetts |
0.52 |
|
Washoe County, Nevada |
0.52 |
|
St. Lucie County, Florida |
0.5 |
|
Pennington County, South Dakota |
0.5 |
|
Erie County, New York |
0.48 |
|
San Joaquin County, California |
0.45 |
|
Rockingham County, New Hampshire |
0.45 |
|
Delaware County, Pennsylvania |
0.45 |
|
Stark County, Ohio |
0.44 |
|
Tarrant County, Texas |
0.43 |
|
Johnson County, Kansas |
0.42 |
|
Jefferson County, Kentucky |
0.42 |
|
Hennepin County, Minnesota |
0.41 |
|
Hamilton County, Ohio |
0.41 |
|
Montgomery County, Pennsylvania |
0.39 |
|
Monroe County, New York |
0.38 |
|
Unknown Or Undefined, Georgia |
0.37 |
|
Middlesex County, Massachusetts |
0.37 |
|
Warren County, Ohio |
0.37 |
|
Bexar County, Texas |
0.37 |
|
El Paso County, Texas |
0.35 |
|
Hillsborough County, New Hampshire |
0.33 |
|
Utah County, Utah |
0.33 |
|
Alameda County, California |
0.32 |
|
Tazewell County, Illinois |
0.32 |
|
Linn County, Oregon |
0.32 |
|
Olmsted County, Minnesota |
0.29 |
|
Cheshire County, New Hampshire |
0.29 |
|
Montgomery County, Alabama |
0.28 |
|
Jefferson County, Colorado |
0.27 |
|
Baltimore County, Maryland |
0.27 |
|
Anchorage Borough, Alaska |
0.25 |
|
Contra Costa County, California |
0.24 |
|
Jackson County, Missouri |
0.2 |
|
Travis County, Texas |
0.2 |
|
Norfolk County, Massachusetts |
0.18 |
|
Macomb County, Michigan |
0.18 |
|
Orange County, Florida |
0.17 |
|
St. Louis County, Minnesota |
0.17 |
|
Genesee County, Michigan |
0.16 |
|
Palm Beach County, Florida |
0.14 |
|
Greenville County, South Carolina |
0.14 |
|
Los Angeles County, California |
0.12 |
|
Milwaukee County, Wisconsin |
0.11 |
|
Middlesex County, New Jersey |
0.06 |
|
Source: U.S. Bureau of Labor Statistics, Quarterly Census of Employment and Wages. |
|
| Occupation | Percent of occupation in nonmetallic mineral mining and quarrying | Total employment | Employment in nonmetallic mineral mining and quarrying |
|---|---|---|---|
| Rock splitters, quarry | 80.5 | 3,790 | 3,050 |
| Dredge operators | 46.5 | 1,850 | 860 |
| Crushing, grinding, and polishing machine setters, operators, and tenders | 12.2 | 31,140 | 3,800 |
| Source: U.S. Bureau of Labor Statistics, Occupational Employment Statistics. | |||
| Area | Location Quotient |
|---|---|
|
West Montana nonmetropolitan area |
67.76 |
|
Northern Pennsylvania nonmetropolitan area |
49.43 |
|
Prescott, Arizona |
46.03 |
|
Southwest Colorado nonmetropolitan area |
30.27 |
|
Athens-Clarke County, Georgia |
24.84 |
|
Mountain North Carolina nonmetropolitan area |
23.34 |
|
Fort Smith, AR-OK |
12.69 |
|
Killeen-Temple, Texas |
11.57 |
|
Washington-Arlington-Alexandria, DC-VA-MD-WV Metropolitan Division |
1.55 |
| Source: U.S. Bureau of Labor Statistics, Occupational Employment Statistics. | |
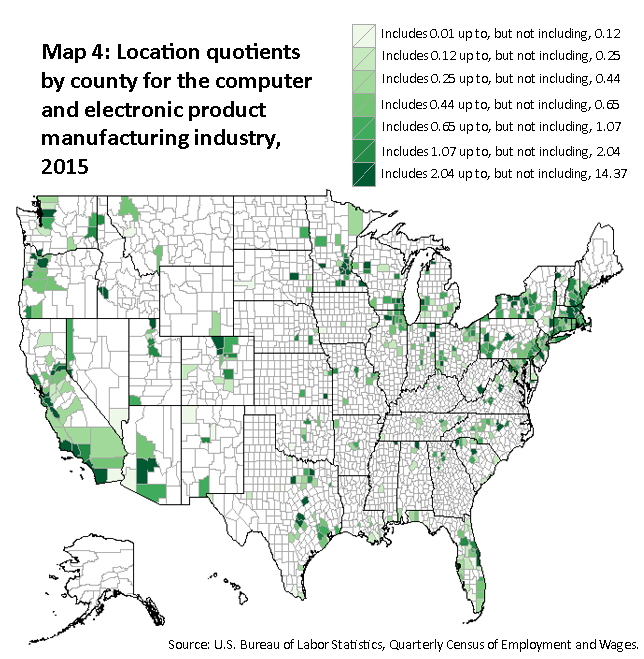
Note: The North American Industry Classification System groups this industry under “computer and electronic product manufacturing.”
| County | Location quotient |
|---|---|
|
Santa Clara County, California |
14.37 |
|
Washington County, Oregon |
13.42 |
|
Waseca County, Minnesota |
10.93 |
|
Huntington County, Indiana |
9.12 |
|
Carver County, Minnesota |
8.87 |
|
Winona County, Minnesota |
8.27 |
|
Brevard County, Florida |
8.1 |
|
Chippewa County, Minnesota |
8 |
|
Aguadilla Municipio, Puerto Rico |
7.71 |
|
Dutchess County, New York |
7.65 |
| Source: U.S. Bureau of Labor Statistics, Quarterly Census on Employment and Wages. | |
| County | Location quotient |
|---|---|
|
Santa Clara County, California |
14.37 |
|
Washington County, Oregon |
13.42 |
|
Waseca County, Minnesota |
10.93 |
|
Huntington County, Indiana |
9.12 |
|
Carver County, Minnesota |
8.87 |
|
Winona County, Minnesota |
8.27 |
|
Brevard County, Florida |
8.1 |
|
Chippewa County, Minnesota |
8 |
|
Aguadilla Municipio, Puerto Rico |
7.71 |
|
Dutchess County, New York |
7.65 |
|
Chippewa County, Wisconsin |
7.01 |
|
Hillsborough County, New Hampshire |
6.94 |
|
Durham County, North Carolina |
6.87 |
|
Boulder County, Colorado |
6.29 |
|
Benton County, Oregon |
6.13 |
|
Ottawa County, Michigan |
6.1 |
|
Douglas County, Nevada |
5.82 |
|
Anoka County, Minnesota |
5.77 |
|
Broomfield County, Colorado |
5.69 |
|
Wayne County, New York |
5.55 |
|
Ada County, Idaho |
5.53 |
|
Chittenden County, Vermont |
5.27 |
|
Williamson County, Texas |
5.18 |
|
Middlesex County, Massachusetts |
5.05 |
|
Fairfield County, South Carolina |
4.75 |
|
Broome County, New York |
4.7 |
|
Collin County, Texas |
4.6 |
|
Travis County, Texas |
4.37 |
|
Palo Pinto County, Texas |
4.35 |
|
Newport County, Rhode Island |
4.04 |
|
Centre County, Pennsylvania |
3.82 |
|
Madison County, Alabama |
3.76 |
|
Scott County, Minnesota |
3.7 |
|
Cache County, Utah |
3.54 |
|
Ontario County, New York |
3.51 |
|
Larimer County, Colorado |
3.4 |
|
Essex County, Massachusetts |
3.22 |
|
Beadle County, South Dakota |
3.12 |
|
Alameda County, California |
3.09 |
|
Alcorn County, Mississippi |
3.07 |
|
Burlington County, New Jersey |
3.06 |
|
Forsyth County, Georgia |
3.05 |
|
McLennan County, Texas |
3.04 |
|
Unknown Or Undefined, Idaho |
3.02 |
|
Loudoun County, Virginia |
3 |
|
Charlevoix County, Michigan |
2.99 |
|
Clackamas County, Oregon |
2.94 |
|
Orange County, California |
2.9 |
|
Ramsey County, Minnesota |
2.9 |
|
Wake County, North Carolina |
2.85 |
|
Ogle County, Illinois |
2.84 |
|
Clark County, Washington |
2.81 |
|
Canyon County, Idaho |
2.79 |
|
Placer County, California |
2.72 |
|
Pickens County, South Carolina |
2.64 |
|
Snohomish County, Washington |
2.61 |
|
Tolland County, Connecticut |
2.6 |
|
Waukesha County, Wisconsin |
2.58 |
|
Butler County, Pennsylvania |
2.5 |
|
Neosho County, Kansas |
2.48 |
|
Belknap County, New Hampshire |
2.48 |
|
Monroe County, New York |
2.48 |
|
Pinellas County, Florida |
2.46 |
|
Hennepin County, Minnesota |
2.46 |
|
San Diego County, California |
2.43 |
|
Warren County, Ohio |
2.33 |
|
Santa Barbara County, California |
2.3 |
|
Ventura County, California |
2.3 |
|
Greenbrier County, West Virginia |
2.3 |
|
Dakota County, Minnesota |
2.29 |
|
Albemarle County, Virginia |
2.25 |
|
Worcester County, Massachusetts |
2.22 |
|
Allen County, Indiana |
2.19 |
|
Maricopa County, Arizona |
2.14 |
|
San Benito County, California |
2.11 |
|
Onondaga County, New York |
2.04 |
|
Nevada County, California |
1.99 |
|
San Mateo County, California |
1.99 |
|
Washington County, New York |
1.99 |
|
Fayette County, Georgia |
1.98 |
|
Roanoke County, Virginia |
1.97 |
|
Isanti County, Minnesota |
1.96 |
|
Suffolk County, New York |
1.96 |
|
Sonoma County, California |
1.94 |
|
Strafford County, New Hampshire |
1.94 |
|
Rockingham County, New Hampshire |
1.92 |
|
Tompkins County, New York |
1.9 |
|
Gwinnett County, Georgia |
1.86 |
|
Lancaster County, Nebraska |
1.85 |
|
Dallas County, Texas |
1.75 |
|
Santa Cruz County, California |
1.74 |
|
Walworth County, Wisconsin |
1.72 |
|
Whitman County, Washington |
1.69 |
|
Anderson County, Tennessee |
1.68 |
|
Hamilton County, Nebraska |
1.67 |
|
Lake County, Ohio |
1.67 |
|
Fayette County, Kentucky |
1.66 |
|
Chemung County, New York |
1.64 |
|
Utah County, Utah |
1.64 |
|
Marion County, Florida |
1.63 |
|
Fayette County, Pennsylvania |
1.61 |
|
Norfolk County, Massachusetts |
1.6 |
|
Grafton County, New Hampshire |
1.59 |
|
Lake County, Illinois |
1.58 |
|
Chester County, Pennsylvania |
1.57 |
|
El Paso County, Colorado |
1.55 |
|
Madison County, New York |
1.54 |
|
Salt Lake County, Utah |
1.54 |
|
Passaic County, New Jersey |
1.53 |
|
Adams County, Colorado |
1.51 |
|
Montgomery County, Maryland |
1.5 |
|
DeKalb County, Illinois |
1.48 |
|
Bedford County, Virginia |
1.47 |
|
New Haven County, Connecticut |
1.46 |
|
DuPage County, Illinois |
1.42 |
|
Litchfield County, Connecticut |
1.41 |
|
Johnson County, Indiana |
1.41 |
|
Wicomico County, Maryland |
1.4 |
|
Jefferson County, Wisconsin |
1.4 |
|
Fort Bend County, Texas |
1.37 |
|
Eau Claire County, Wisconsin |
1.35 |
|
Niagara County, New York |
1.34 |
|
Portage County, Ohio |
1.34 |
|
Harford County, Maryland |
1.29 |
|
Oneida County, New York |
1.28 |
|
Bernalillo County, New Mexico |
1.27 |
|
Milwaukee County, Wisconsin |
1.27 |
|
New Castle County, Delaware |
1.25 |
|
Williams County, Ohio |
1.25 |
|
Payne County, Oklahoma |
1.25 |
|
Blue Earth County, Minnesota |
1.23 |
|
Westmoreland County, Pennsylvania |
1.23 |
|
Volusia County, Florida |
1.22 |
|
Los Angeles County, California |
1.18 |
|
Nash County, North Carolina |
1.17 |
|
Bucks County, Pennsylvania |
1.15 |
|
Jackson County, Missouri |
1.14 |
|
Josephine County, Oregon |
1.13 |
|
Bergen County, New Jersey |
1.12 |
|
Westchester County, New York |
1.12 |
|
Outagamie County, Wisconsin |
1.12 |
|
Kootenai County, Idaho |
1.11 |
|
Boone County, Missouri |
1.11 |
|
Kent County, Rhode Island |
1.11 |
|
Fairfield County, Connecticut |
1.1 |
|
Morris County, New Jersey |
1.1 |
|
Delaware County, Ohio |
1.1 |
|
Unknown Or Undefined, California |
1.09 |
|
Bristol County, Massachusetts |
1.07 |
|
Montgomery County, Pennsylvania |
1.07 |
|
McHenry County, Illinois |
1.06 |
|
Otsego County, New York |
1.06 |
|
Guilford County, North Carolina |
1.06 |
|
Kent County, Michigan |
1.05 |
|
Elkhart County, Indiana |
1.04 |
|
Erie County, Pennsylvania |
1.04 |
|
Cattaraugus County, New York |
1.03 |
|
Sedgwick County, Kansas |
1.02 |
|
Montgomery County, Ohio |
1.02 |
|
Martin County, Florida |
1.01 |
|
Camden County, New Jersey |
1.01 |
|
Middlesex County, Connecticut |
1 |
|
Washington County, Tennessee |
1 |
|
Cayuga County, New York |
0.99 |
|
Somerset County, New Jersey |
0.97 |
|
Hampton City, Virginia |
0.97 |
|
Barnstable County, Massachusetts |
0.96 |
|
Bartow County, Georgia |
0.95 |
|
Kane County, Illinois |
0.95 |
|
Cambria County, Pennsylvania |
0.95 |
|
Cumberland County, Maine |
0.93 |
|
Cass County, North Dakota |
0.92 |
|
Washington County, Pennsylvania |
0.92 |
|
Plymouth County, Massachusetts |
0.91 |
|
Otter Tail County, Minnesota |
0.91 |
|
Buncombe County, North Carolina |
0.91 |
|
Johnson County, Kansas |
0.9 |
|
Geauga County, Ohio |
0.9 |
|
Denton County, Texas |
0.88 |
|
Pima County, Arizona |
0.87 |
|
Howard County, Maryland |
0.87 |
|
St. Charles County, Missouri |
0.87 |
|
Dane County, Wisconsin |
0.87 |
|
Catawba County, North Carolina |
0.85 |
|
Washington County, Utah |
0.85 |
|
King County, Washington |
0.85 |
|
Washoe County, Nevada |
0.84 |
|
Carson City, Nevada |
0.84 |
|
Gregg County, Texas |
0.84 |
|
Mille Lacs County, Minnesota |
0.83 |
|
Lexington County, South Carolina |
0.83 |
|
Saginaw County, Michigan |
0.82 |
|
Kenosha County, Wisconsin |
0.82 |
|
Chenango County, New York |
0.81 |
|
Union County, North Carolina |
0.81 |
|
Seminole County, Florida |
0.8 |
|
Allegheny County, Pennsylvania |
0.8 |
|
Will County, Illinois |
0.79 |
|
Cuyahoga County, Ohio |
0.79 |
|
Greene County, Ohio |
0.78 |
|
Harris County, Texas |
0.78 |
|
Hampshire County, Massachusetts |
0.77 |
|
Rensselaer County, New York |
0.77 |
|
Allegan County, Michigan |
0.76 |
|
Merrimack County, New Hampshire |
0.75 |
|
Lynchburg City, Virginia |
0.75 |
|
Washtenaw County, Michigan |
0.74 |
|
Waller County, Texas |
0.74 |
|
Spokane County, Washington |
0.73 |
|
Monmouth County, New Jersey |
0.72 |
|
Greenville County, South Carolina |
0.72 |
|
Racine County, Wisconsin |
0.71 |
|
Weld County, Colorado |
0.7 |
|
Miami County, Ohio |
0.7 |
|
Cleveland County, Oklahoma |
0.7 |
|
Dona Ana County, New Mexico |
0.69 |
|
Erie County, New York |
0.69 |
|
Jefferson County, Texas |
0.69 |
|
Kenton County, Kentucky |
0.68 |
|
Rice County, Minnesota |
0.68 |
|
Summit County, Ohio |
0.68 |
|
Grand Traverse County, Michigan |
0.66 |
|
Pulaski County, Arkansas |
0.65 |
|
York County, Maine |
0.65 |
|
Lehigh County, Pennsylvania |
0.65 |
|
Washington County, Rhode Island |
0.65 |
|
Greene County, Missouri |
0.64 |
|
Middlesex County, New Jersey |
0.64 |
|
Brazoria County, Texas |
0.64 |
|
Grant County, Wisconsin |
0.64 |
|
Gloucester County, New Jersey |
0.63 |
|
York County, Pennsylvania |
0.63 |
|
Amador County, California |
0.62 |
|
Hartford County, Connecticut |
0.62 |
|
Franklin County, Missouri |
0.62 |
|
Forsyth County, North Carolina |
0.62 |
|
Multnomah County, Oregon |
0.61 |
|
Orange County, Florida |
0.6 |
|
Knox County, Tennessee |
0.6 |
|
Contra Costa County, California |
0.59 |
|
LaSalle County, Illinois |
0.59 |
|
Winnebago County, Illinois |
0.59 |
|
Flathead County, Montana |
0.59 |
|
Tulsa County, Oklahoma |
0.59 |
|
Unknown Or Undefined, South Carolina |
0.59 |
|
Minnehaha County, South Dakota |
0.59 |
|
Charlottesville City, Virginia |
0.59 |
|
Sacramento County, California |
0.58 |
|
Crow Wing County, Minnesota |
0.58 |
|
Gallatin County, Montana |
0.58 |
|
Butler County, Ohio |
0.58 |
|
Jackson County, Oregon |
0.58 |
|
Okaloosa County, Florida |
0.57 |
|
Howard County, Indiana |
0.57 |
|
Lafayette Parish, Louisiana |
0.57 |
|
Jefferson County, Colorado |
0.56 |
|
Unknown Or Undefined, Illinois |
0.56 |
|
Washington County, Arkansas |
0.55 |
|
Rowan County, North Carolina |
0.55 |
|
Marion County, Oregon |
0.55 |
|
Dauphin County, Pennsylvania |
0.55 |
|
Ascension Parish, Louisiana |
0.54 |
|
Hood River County, Oregon |
0.54 |
|
Northampton County, Pennsylvania |
0.54 |
|
Hays County, Texas |
0.54 |
|
Yavapai County, Arizona |
0.53 |
|
Riverside County, California |
0.53 |
|
Frederick County, Maryland |
0.53 |
|
Steuben County, New York |
0.53 |
|
Yolo County, California |
0.52 |
|
Cook County, Illinois |
0.52 |
|
Mercer County, New Jersey |
0.52 |
|
Lane County, Oregon |
0.52 |
|
Providence County, Rhode Island |
0.52 |
|
Weber County, Utah |
0.52 |
|
San Francisco County, California |
0.51 |
|
Marion County, Indiana |
0.51 |
|
Lancaster County, Pennsylvania |
0.51 |
|
Mercer County, Pennsylvania |
0.51 |
|
Montgomery County, Texas |
0.51 |
|
Broward County, Florida |
0.5 |
|
St. Joseph County, Indiana |
0.5 |
|
Warren County, New Jersey |
0.5 |
|
Deschutes County, Oregon |
0.5 |
|
Unknown Or Undefined, Arizona |
0.49 |
|
El Dorado County, California |
0.49 |
|
Windham County, Connecticut |
0.49 |
|
Unknown Or Undefined, Michigan |
0.49 |
|
Berks County, Pennsylvania |
0.49 |
|
Bastrop County, Texas |
0.49 |
|
Palm Beach County, Florida |
0.48 |
|
Sarasota County, Florida |
0.48 |
|
Hamilton County, Indiana |
0.48 |
|
Washington County, Minnesota |
0.48 |
|
Davidson County, North Carolina |
0.48 |
|
Wayne County, Ohio |
0.48 |
|
Linn County, Oregon |
0.48 |
|
Hampden County, Massachusetts |
0.47 |
|
Oakland County, Michigan |
0.47 |
|
Cumberland County, Pennsylvania |
0.47 |
|
St. Croix County, Wisconsin |
0.47 |
|
Nassau County, New York |
0.46 |
|
Alachua County, Florida |
0.45 |
|
St. Louis County, Missouri |
0.45 |
|
Tippecanoe County, Indiana |
0.44 |
|
St. Louis County, Minnesota |
0.43 |
|
Essex County, New Jersey |
0.43 |
|
Mecklenburg County, North Carolina |
0.43 |
|
Ozaukee County, Wisconsin |
0.43 |
|
Manatee County, Florida |
0.41 |
|
Unknown Or Undefined, Florida |
0.41 |
|
Brazos County, Texas |
0.41 |
|
Whatcom County, Washington |
0.41 |
|
Albany County, Wyoming |
0.4 |
|
Fresno County, California |
0.39 |
|
Jefferson Parish, Louisiana |
0.39 |
|
Guadalupe County, Texas |
0.39 |
|
Rockingham County, Virginia |
0.39 |
|
Tuolumne County, California |
0.38 |
|
Columbia County, New York |
0.38 |
|
Johnson County, Texas |
0.38 |
|
Morgan County, Alabama |
0.37 |
|
Polk County, Iowa |
0.37 |
|
Wayne County, Michigan |
0.37 |
|
Rockland County, New York |
0.37 |
|
Monterey County, California |
0.36 |
|
New London County, Connecticut |
0.36 |
|
Harrison County, Mississippi |
0.36 |
|
Iredell County, North Carolina |
0.36 |
|
Stafford County, Virginia |
0.36 |
|
Mobile County, Alabama |
0.35 |
|
Miami-Dade County, Florida |
0.35 |
|
Moore County, North Carolina |
0.35 |
|
Tarrant County, Texas |
0.35 |
|
Arapahoe County, Colorado |
0.34 |
|
Champaign County, Illinois |
0.34 |
|
Porter County, Indiana |
0.34 |
|
San Luis Obispo County, California |
0.33 |
|
Hunterdon County, New Jersey |
0.33 |
|
Franklin County, Ohio |
0.33 |
|
Armstrong County, Pennsylvania |
0.33 |
|
Santa Rosa County, Florida |
0.32 |
|
Monroe County, Indiana |
0.32 |
|
Prince George's County, Maryland |
0.32 |
|
Wright County, Minnesota |
0.31 |
|
Stark County, Ohio |
0.31 |
|
Nueces County, Texas |
0.31 |
|
Unknown Or Undefined, Texas |
0.31 |
|
Saline County, Arkansas |
0.3 |
|
Tazewell County, Illinois |
0.3 |
|
Unknown Or Undefined, New Jersey |
0.3 |
|
Clermont County, Ohio |
0.3 |
|
Delaware County, Pennsylvania |
0.3 |
|
Spartanburg County, South Carolina |
0.3 |
|
York County, South Carolina |
0.3 |
|
Bexar County, Texas |
0.3 |
|
Newport News City, Virginia |
0.3 |
|
Kern County, California |
0.29 |
|
San Bernardino County, California |
0.29 |
|
Hillsborough County, Florida |
0.29 |
|
Oklahoma County, Oklahoma |
0.29 |
|
Blount County, Tennessee |
0.29 |
|
Benton County, Washington |
0.29 |
|
Baltimore County, Maryland |
0.28 |
|
Wilson County, Tennessee |
0.28 |
|
Fairfax County, Virginia |
0.28 |
|
Wayne County, Indiana |
0.27 |
|
Albany County, New York |
0.27 |
|
Queens County, New York |
0.27 |
|
Alamance County, North Carolina |
0.27 |
|
Columbiana County, Ohio |
0.27 |
|
Hamilton County, Ohio |
0.27 |
|
Mahoning County, Ohio |
0.27 |
|
Unknown Or Undefined, Oklahoma |
0.27 |
|
Carroll County, Maryland |
0.26 |
|
Oswego County, New York |
0.26 |
|
Frederick County, Virginia |
0.26 |
|
Butte County, California |
0.25 |
|
Jefferson County, Kentucky |
0.25 |
|
Douglas County, Nebraska |
0.25 |
|
Fairfield County, Ohio |
0.25 |
|
Medina County, Ohio |
0.25 |
|
Kaufman County, Texas |
0.25 |
|
Cheshire County, New Hampshire |
0.24 |
|
Unknown Or Undefined, New York |
0.24 |
|
Lorain County, Ohio |
0.24 |
|
Wichita County, Texas |
0.24 |
|
Spotsylvania County, Virginia |
0.24 |
|
Sussex County, Delaware |
0.23 |
|
Macomb County, Michigan |
0.23 |
|
Van Buren County, Michigan |
0.23 |
|
Athens County, Ohio |
0.23 |
|
Richland County, South Carolina |
0.23 |
|
Prince William County, Virginia |
0.23 |
|
Calaveras County, California |
0.22 |
|
Shasta County, California |
0.22 |
|
Cobb County, Georgia |
0.22 |
|
Livingston County, Michigan |
0.22 |
|
Horry County, South Carolina |
0.22 |
|
El Paso County, Texas |
0.22 |
|
Pasco County, Florida |
0.21 |
|
Ionia County, Michigan |
0.21 |
|
Unknown Or Undefined, New Mexico |
0.21 |
|
Brookings County, South Dakota |
0.21 |
|
Davidson County, Tennessee |
0.21 |
|
Davis County, Utah |
0.21 |
|
Pierce County, Washington |
0.21 |
|
Skagit County, Washington |
0.21 |
|
Marin County, California |
0.2 |
|
Unknown Or Undefined, Maryland |
0.2 |
|
Unknown Or Undefined, Wisconsin |
0.2 |
|
Mesa County, Colorado |
0.19 |
|
McLean County, Illinois |
0.19 |
|
Cameron County, Texas |
0.19 |
|
Washington County, Vermont |
0.19 |
|
Washington County, Wisconsin |
0.19 |
|
Kendall County, Illinois |
0.18 |
|
Douglas County, Kansas |
0.18 |
|
Carroll County, New Hampshire |
0.18 |
|
Ulster County, New York |
0.18 |
|
Gaston County, North Carolina |
0.18 |
|
Galveston County, Texas |
0.18 |
|
San Joaquin County, California |
0.17 |
|
Lake County, Florida |
0.17 |
|
Polk County, Florida |
0.17 |
|
Union County, New Jersey |
0.17 |
|
Charleston County, South Carolina |
0.17 |
|
Shelby County, Tennessee |
0.17 |
|
Ector County, Texas |
0.17 |
|
Fremont County, Colorado |
0.16 |
|
Lee County, Florida |
0.16 |
|
East Baton Rouge Parish, Louisiana |
0.16 |
|
Androscoggin County, Maine |
0.16 |
|
Caroline County, Maryland |
0.16 |
|
Sarpy County, Nebraska |
0.16 |
|
Rutherford County, Tennessee |
0.16 |
|
Parker County, Texas |
0.16 |
|
Rockwall County, Texas |
0.16 |
|
Fairfax City, Virginia |
0.16 |
|
Pueblo County, Colorado |
0.15 |
|
Jefferson County, Alabama |
0.14 |
|
Indian River County, Florida |
0.14 |
|
Hall County, Georgia |
0.14 |
|
Bartholomew County, Indiana |
0.14 |
|
Scott County, Iowa |
0.14 |
|
Kalamazoo County, Michigan |
0.14 |
|
Muskegon County, Michigan |
0.14 |
|
Unknown Or Undefined, Minnesota |
0.14 |
|
Susquehanna County, Pennsylvania |
0.14 |
|
Unknown Or Undefined, Tennessee |
0.14 |
|
Fredericksburg City, Virginia |
0.14 |
|
Stanislaus County, California |
0.13 |
|
Clay County, Florida |
0.13 |
|
Duval County, Florida |
0.13 |
|
St. Johns County, Florida |
0.13 |
|
Terrebonne Parish, Louisiana |
0.13 |
|
Rankin County, Mississippi |
0.13 |
|
Kings County, New York |
0.13 |
|
Unknown Or Undefined, North Carolina |
0.13 |
|
DeKalb County, Georgia |
0.12 |
|
Ingham County, Michigan |
0.12 |
|
Unknown Or Undefined, Washington |
0.12 |
|
Marathon County, Wisconsin |
0.12 |
|
Crawford County, Arkansas |
0.11 |
|
Unknown Or Undefined, Georgia |
0.11 |
|
Richmond County, New York |
0.11 |
|
Beaufort County, South Carolina |
0.11 |
|
Hamilton County, Tennessee |
0.11 |
|
Taylor County, Texas |
0.11 |
|
Arlington County, Virginia |
0.11 |
|
Citrus County, Florida |
0.1 |
|
Fulton County, Georgia |
0.1 |
|
Unknown Or Undefined, Kentucky |
0.1 |
|
Rogers County, Oklahoma |
0.1 |
|
Yamhill County, Oregon |
0.1 |
|
Augusta County, Virginia |
0.1 |
|
Imperial County, California |
0.09 |
|
Solano County, California |
0.09 |
|
Pottawattamie County, Iowa |
0.09 |
|
Queen Anne's County, Maryland |
0.09 |
|
Washington County, Maryland |
0.09 |
|
New York County, New York |
0.09 |
|
Clark County, Ohio |
0.09 |
|
Union County, Ohio |
0.09 |
|
Montgomery County, Virginia |
0.09 |
|
Virginia Beach City, Virginia |
0.09 |
|
Bay County, Florida |
0.08 |
|
Caddo Parish, Louisiana |
0.08 |
|
Suffolk County, Massachusetts |
0.08 |
|
Clark County, Nevada |
0.08 |
|
Ocean County, New Jersey |
0.08 |
|
Salem County, New Jersey |
0.08 |
|
Lucas County, Ohio |
0.08 |
|
Unknown Or Undefined, Oregon |
0.08 |
|
Unknown Or Undefined, Alabama |
0.07 |
|
Denver County, Colorado |
0.07 |
|
Collier County, Florida |
0.07 |
|
St. Tammany Parish, Louisiana |
0.07 |
|
Unknown Or Undefined, Louisiana |
0.07 |
|
Unknown Or Undefined, Virginia |
0.07 |
|
Brown County, Wisconsin |
0.07 |
|
Yuma County, Arizona |
0.06 |
|
Leon County, Florida |
0.06 |
|
Boone County, Kentucky |
0.06 |
|
Missoula County, Montana |
0.06 |
|
Cape May County, New Jersey |
0.06 |
|
Knox County, Ohio |
0.06 |
|
Unknown Or Undefined, Ohio |
0.06 |
|
Franklin County, Pennsylvania |
0.06 |
|
Philadelphia County, Pennsylvania |
0.06 |
|
Hidalgo County, Texas |
0.06 |
|
Chesterfield County, Virginia |
0.06 |
|
Kitsap County, Washington |
0.06 |
|
Thurston County, Washington |
0.06 |
|
Kanawha County, West Virginia |
0.06 |
|
Honolulu County, Hawaii |
0.05 |
|
Dubuque County, Iowa |
0.05 |
|
Charles County, Maryland |
0.05 |
|
Baltimore City, Maryland |
0.05 |
|
Orange County, North Carolina |
0.05 |
|
Comanche County, Oklahoma |
0.05 |
|
Kings County, California |
0.04 |
|
Douglas County, Colorado |
0.04 |
|
Osceola County, Florida |
0.04 |
|
Madison County, Indiana |
0.04 |
|
Hudson County, New Jersey |
0.04 |
|
Bronx County, New York |
0.04 |
|
Cumberland County, North Carolina |
0.04 |
|
Chesapeake City, Virginia |
0.04 |
|
Richmond City, Virginia |
0.04 |
|
San Juan Municipio, Puerto Rico |
0.04 |
|
Chatham County, Georgia |
0.03 |
|
Vanderburgh County, Indiana |
0.03 |
|
Oldham County, Kentucky |
0.03 |
|
St. Louis City, Missouri |
0.03 |
|
San Juan County, New Mexico |
0.03 |
|
Santa Fe County, New Mexico |
0.03 |
|
Cabarrus County, North Carolina |
0.03 |
|
Pennington County, South Dakota |
0.03 |
|
Paulding County, Georgia |
0.02 |
|
Madison County, Illinois |
0.02 |
|
Unknown Or Undefined, Indiana |
0.02 |
|
Lafourche Parish, Louisiana |
0.02 |
|
St. Clair County, Michigan |
0.02 |
|
Clay County, Missouri |
0.02 |
|
Unknown Or Undefined, Missouri |
0.02 |
|
Henrico County, Virginia |
0.02 |
|
Norfolk City, Virginia |
0.02 |
|
Cherokee County, Georgia |
0.01 |
|
Houston County, Georgia |
0.01 |
|
Peoria County, Illinois |
0.01 |
|
Schenectady County, New York |
0.01 |
|
New Hanover County, North Carolina |
0.01 |
|
Source: U.S. Bureau of Labor Statistics, Quarterly Census of Employment and Wages. |
|
| Occupation | Percent of occupation in computer and electronic products manufacturing | Total employment | Employment in computer and electronic products manufacturing |
|---|---|---|---|
| Semiconductor processors | 93.1 | 24,230 | 22,570 |
| Timing device assemblers and adjusters | 46.2 | 1,190 | 550 |
| Electrical and electronic equipment assemblers | 45.8 | 212,170 | 97,200 |
| Computer hardware engineers | 37.4 | 75,870 | 28,370 |
| Electromechanical equipment assemblers | 30.3 | 46,400 | 14,060 |
| Electrical and electronics engineering technicians | 27.3 | 139,080 | 38,010 |
| Electro-mechanical technicians | 26.8 | 14,720 | 3,950 |
| Industrial engineering technicians | 20.4 | 62,290 | 12,730 |
| Source: U.S. Bureau of Labor Statistics, Occupational Employment Statistics. | |||
| Area | Location quotient |
|---|---|
|
Portland-Vancouver-Hillsboro, OR-WA |
19.38 |
|
San Jose-Sunnyvale-Santa Clara, CA |
13.11 |
|
Austin-Round Rock, Texas |
5.90 |
|
Dallas-Plano-Irving, Texas Metropolitan Division |
5.36 |
|
Greensboro-High Point, North Carolina |
4.81 |
|
Anaheim-Santa Ana-Irvine, California Metropolitan Division |
4.53 |
|
Albuquerque, New Mexico |
4.01 |
|
Oakland-Hayward-Berkeley, California Metropolitan Division |
2.93 |
|
Providence-Warwick, RI-MA |
2.89 |
|
Phoenix-Mesa-Scottsdale, Arizona |
1.86 |
| Source: U.S. Bureau of Labor Statistics, Occupational Employment Statistics. | |
Note : The OES survey excludes most of the agricultural sector, with the exception of logging, support activities for crop production, and support activities for animal production. The OES survey does not include the fishing industry; therefore, occupation location quotients cannot be calculated.
| County | Location quotient |
|---|---|
|
Pacific County, Washington |
891.83 |
|
Knox County, Maine |
415.8 |
|
Petersburg Census Area, Alaska |
303.2 |
|
Kodiak Island Borough, Alaska |
221.88 |
|
Northumberland County, Virginia |
220.34 |
|
Del Norte County, California |
219.79 |
|
Unknown Or Undefined, Nevada |
138.59 |
|
Lincoln County, Oregon |
128.72 |
|
Lincoln County, Maine |
114.78 |
|
Curry County, Oregon |
114.05 |
| Source: U.S. Bureau of Labor Statistics, Quarterly Census of Employment and Wages. | |

| County | Location quotient |
|---|---|
|
Pacific County, Washington |
891.83 |
|
Knox County, Maine |
415.8 |
|
Petersburg Census Area, Alaska |
303.2 |
|
Kodiak Island Borough, Alaska |
221.88 |
|
Northumberland County, Virginia |
220.34 |
|
Del Norte County, California |
219.79 |
|
Unknown Or Undefined, Nevada |
138.59 |
|
Lincoln County, Oregon |
128.72 |
|
Lincoln County, Maine |
114.78 |
|
Curry County, Oregon |
114.05 |
|
Bristol County, Massachusetts |
101.65 |
|
Aleutian West Census Area, Alaska |
87.84 |
|
Grays Harbor County, Washington |
77.74 |
|
Valdez-Cordova Census Area, Alaska |
73.21 |
|
Hancock County, Maine |
67.9 |
|
Unknown Or Undefined, Alaska |
66.65 |
|
Coos County, Oregon |
53.47 |
|
Clatsop County, Oregon |
51.53 |
|
Washington County, Maine |
50.55 |
|
Kenai Peninsula Borough, Alaska |
49.91 |
|
Cape May County, New Jersey |
44.31 |
|
Monroe County, Florida |
38.17 |
|
Chippewa County, Michigan |
34.68 |
|
Terrebonne Parish, Louisiana |
34.03 |
|
Mendocino County, California |
33.12 |
|
Sitka Borough, Alaska |
31.25 |
|
Aleutian East Borough, Alaska |
30.04 |
|
Humboldt County, California |
29.81 |
|
Washington County, Rhode Island |
25.45 |
|
King County, Washington |
17.26 |
|
Barnstable County, Massachusetts |
12.96 |
|
Essex County, Massachusetts |
11.5 |
|
Newport County, Rhode Island |
10.83 |
|
Chambers County, Texas |
9.11 |
|
St. Tammany Parish, Louisiana |
8.66 |
|
Unknown Or Undefined, Massachusetts |
7.72 |
|
Cumberland County, Maine |
7.53 |
|
Gloucester County, Virginia |
7.49 |
|
Ocean County, New Jersey |
7.29 |
|
Douglas County, Oregon |
6.41 |
|
Honolulu County, Hawaii |
5.99 |
|
Snohomish County, Washington |
5.48 |
|
Citrus County, Florida |
5.11 |
|
Monterey County, California |
5.03 |
|
Newport News City, Virginia |
3.33 |
|
Okaloosa County, Florida |
2.62 |
|
Plymouth County, Massachusetts |
2.49 |
|
Pierce County, Washington |
2.12 |
|
Bay County, Florida |
1.83 |
|
Thurston County, Washington |
1.53 |
|
Virginia Beach City, Virginia |
1.34 |
|
Ventura County, California |
1.03 |
|
Lucas County, Ohio |
1.01 |
|
Collier County, Florida |
0.86 |
|
Pinellas County, Florida |
0.85 |
|
Chatham County, Georgia |
0.8 |
|
Hillsborough County, Florida |
0.43 |
|
Broward County, Florida |
0.37 |
|
Palm Beach County, Florida |
0.29 |
|
Miami-Dade County, Florida |
0.13 |
|
Source: U.S. Bureau of Labor Statistics, Quarterly Census of Employment and Wages. |
|
Note: The North American Industry Classification System groups this industry under “electric power generation, transmission and distribution.”
| County | Location quotient |
|---|---|
|
Robertson County, Texas |
23.33 |
|
Camp County, Texas |
16.64 |
|
Person County, North Carolina |
15.73 |
|
Jefferson County, Ohio |
13.55 |
|
Ontonagon County, Michigan |
12.5 |
|
Choctaw County, Oklahoma |
12.26 |
|
Morrow County, Oregon |
11.55 |
|
Bamberg County, South Carolina |
11.05 |
|
Inyo County, California |
10.48 |
|
Beaver County, Pennsylvania |
10.22 |
| Source: U.S. Bureau of Labor Statistics, Quarterly Census of Employment and Wages. | |

| County | Location quotient |
|---|---|
|
Robertson County, Texas |
23.33 |
|
Camp County, Texas |
16.64 |
|
Person County, North Carolina |
15.73 |
|
Jefferson County, Ohio |
13.55 |
|
Ontonagon County, Michigan |
12.5 |
|
Choctaw County, Oklahoma |
12.26 |
|
Morrow County, Oregon |
11.55 |
|
Bamberg County, South Carolina |
11.05 |
|
Inyo County, California |
10.48 |
|
Beaver County, Pennsylvania |
10.22 |
|
Citrus County, Florida |
10.04 |
|
Coshocton County, Ohio |
9.94 |
|
Adams County, Ohio |
9.11 |
|
Childress County, Texas |
9.07 |
|
Indiana County, Pennsylvania |
8.91 |
|
Wilbarger County, Texas |
8.87 |
|
Swift County, Minnesota |
8.13 |
|
Grimes County, Texas |
8.13 |
|
Itasca County, Minnesota |
8.06 |
|
Shelby County, Alabama |
7.88 |
|
Roger Mills County, Oklahoma |
7.86 |
|
Fluvanna County, Virginia |
7.84 |
|
Gibson County, Indiana |
6.89 |
|
Bosque County, Texas |
6.76 |
|
Columbia County, Washington |
6.73 |
|
Hardee County, Florida |
6.63 |
|
Lincoln County, Minnesota |
6.54 |
|
Lexington County, South Carolina |
6.37 |
|
Eureka County, Nevada |
6 |
|
Marion County, West Virginia |
5.73 |
|
Knox County, Indiana |
5.64 |
|
Lewis County, New York |
5.54 |
|
Randolph County, Illinois |
5.28 |
|
Morgan County, Colorado |
5.27 |
|
Lake and Peninsula Borough, Alaska |
5.25 |
|
Harrison County, Texas |
5 |
|
Scurry County, Texas |
4.94 |
|
Valdez-Cordova Census Area, Alaska |
4.92 |
|
Tyler County, Texas |
4.55 |
|
Geneva County, Alabama |
4.52 |
|
Adair County, Iowa |
4.43 |
|
Howard County, Texas |
4.42 |
|
Campbell County, Wyoming |
4.38 |
|
Linn County, Iowa |
3.87 |
|
Fillmore County, Minnesota |
3.86 |
|
Wicomico County, Maryland |
3.81 |
|
White County, Indiana |
3.78 |
|
Morgan County, Indiana |
3.68 |
|
Franklin County, Iowa |
3.65 |
|
Mecklenburg County, Virginia |
3.61 |
|
Lake County, Ohio |
3.57 |
|
New London County, Connecticut |
3.54 |
|
Young County, Texas |
3.5 |
|
Chilton County, Alabama |
3.49 |
|
Richland County, Montana |
3.48 |
|
Dearborn County, Indiana |
3.46 |
|
Garfield County, Colorado |
3.41 |
|
Marquette County, Wisconsin |
3.37 |
|
Hancock County, Iowa |
3.34 |
|
Victoria County, Texas |
3.29 |
|
Baltimore City, Maryland |
3.23 |
|
Forrest County, Mississippi |
3.23 |
|
Woodward County, Oklahoma |
3.23 |
|
Lamar County, Texas |
3.23 |
|
Warren County, Virginia |
3.22 |
|
Coos County, New Hampshire |
3.14 |
|
Jefferson County, Arkansas |
3.12 |
|
Jackson County, Mississippi |
3.12 |
|
Harrison County, West Virginia |
3.11 |
|
Quay County, New Mexico |
3.03 |
|
Fannin County, Texas |
3 |
|
Jackson County, Florida |
2.95 |
|
Washington County, Ohio |
2.93 |
|
Pulaski County, Kentucky |
2.91 |
|
Shelby County, Kentucky |
2.91 |
|
Prowers County, Colorado |
2.9 |
|
Tioga County, Pennsylvania |
2.88 |
|
Hamilton County, Indiana |
2.68 |
|
Palo Pinto County, Texas |
2.68 |
|
Aiken County, South Carolina |
2.64 |
|
Mitchell County, Iowa |
2.51 |
|
Yukon-Koyukuk Census Area, Alaska |
2.42 |
|
York County, Pennsylvania |
2.4 |
|
Sullivan County, New Hampshire |
2.39 |
|
McKenzie County, North Dakota |
2.39 |
|
Pulaski County, Arkansas |
2.35 |
|
Washington County, Maine |
2.35 |
|
Mississippi County, Arkansas |
2.34 |
|
Onondaga County, New York |
2.31 |
|
Clarion County, Pennsylvania |
2.31 |
|
Aleutian East Borough, Alaska |
2.3 |
|
Fairbanks North Star Borough, Alaska |
2.3 |
|
Minidoka County, Idaho |
2.3 |
|
Clearfield County, Pennsylvania |
2.28 |
|
Luna County, New Mexico |
2.27 |
|
Imperial County, California |
2.26 |
|
St. John the Baptist Parish, Louisiana |
2.24 |
|
Pueblo County, Colorado |
2.23 |
|
Freeborn County, Minnesota |
2.21 |
|
San Patricio County, Texas |
2.21 |
|
Potter County, Texas |
2.2 |
|
Pittsylvania County, Virginia |
2.2 |
|
Wise County, Texas |
2.16 |
|
Cherokee County, Texas |
2.15 |
|
Anson County, North Carolina |
2.13 |
|
Hawaii County, Hawaii |
2.12 |
|
Unknown Or Undefined, New York |
2.1 |
|
Lea County, New Mexico |
2.09 |
|
Guadalupe County, Texas |
2.08 |
|
Mohave County, Arizona |
2.02 |
|
Jones County, Mississippi |
2.02 |
|
Ford County, Kansas |
2 |
|
Schuylkill County, Pennsylvania |
1.95 |
|
Tangipahoa Parish, Louisiana |
1.94 |
|
Maui + Kalawao County, Hawaii |
1.93 |
|
Warren County, Pennsylvania |
1.93 |
|
Cochise County, Arizona |
1.92 |
|
Buena Vista County, Iowa |
1.92 |
|
Plymouth County, Massachusetts |
1.91 |
|
Williamson County, Texas |
1.91 |
|
Rockingham County, New Hampshire |
1.88 |
|
Pittsburg County, Oklahoma |
1.88 |
|
Susquehanna County, Pennsylvania |
1.81 |
|
Huron County, Michigan |
1.8 |
|
Henderson County, Texas |
1.77 |
|
Arkansas County, Arkansas |
1.76 |
|
Cherokee County, South Carolina |
1.75 |
|
Campbell County, Virginia |
1.73 |
|
Stone County, Missouri |
1.71 |
|
Ocean County, New Jersey |
1.7 |
|
Muskingum County, Ohio |
1.69 |
|
Seneca County, Ohio |
1.68 |
|
Umatilla County, Oregon |
1.68 |
|
Cassia County, Idaho |
1.66 |
|
St. Lawrence County, New York |
1.66 |
|
Merrimack County, New Hampshire |
1.64 |
|
Hampden County, Massachusetts |
1.6 |
|
Warren County, New Jersey |
1.6 |
|
Nueces County, Texas |
1.6 |
|
Niagara County, New York |
1.59 |
|
Clermont County, Ohio |
1.58 |
|
Bradford County, Pennsylvania |
1.58 |
|
Pecos County, Texas |
1.57 |
|
New Castle County, Delaware |
1.53 |
|
Pima County, Arizona |
1.52 |
|
Van Wert County, Ohio |
1.51 |
|
Harris County, Texas |
1.51 |
|
Walla Walla County, Washington |
1.51 |
|
Nassau County, Florida |
1.5 |
|
Sussex County, Delaware |
1.49 |
|
Taylor County, Texas |
1.48 |
|
Worcester County, Massachusetts |
1.47 |
|
Rockingham County, North Carolina |
1.47 |
|
Wayne County, North Carolina |
1.47 |
|
Williams County, North Dakota |
1.46 |
|
Elko County, Nevada |
1.44 |
|
Queens County, New York |
1.44 |
|
Kootenai County, Idaho |
1.43 |
|
Calcasieu Parish, Louisiana |
1.37 |
|
Seminole County, Florida |
1.35 |
|
Madison County, Illinois |
1.34 |
|
Montague County, Texas |
1.33 |
|
Montgomery County, Pennsylvania |
1.3 |
|
San Bernardino County, California |
1.28 |
|
Orange County, New York |
1.26 |
|
Pennington County, South Dakota |
1.25 |
|
Palo Alto County, Iowa |
1.23 |
|
Whitfield County, Georgia |
1.21 |
|
Butler County, Kansas |
1.2 |
|
Vigo County, Indiana |
1.19 |
|
Sullivan County, New York |
1.19 |
|
Ramsey County, Minnesota |
1.17 |
|
Hancock County, West Virginia |
1.17 |
|
Grand Traverse County, Michigan |
1.16 |
|
Armstrong County, Pennsylvania |
1.16 |
|
Tom Green County, Texas |
1.16 |
|
McLennan County, Texas |
1.15 |
|
Camden County, Missouri |
1.14 |
|
Palm Beach County, Florida |
1.13 |
|
Stoddard County, Missouri |
1.13 |
|
Johnson County, Wyoming |
1.13 |
|
Tulsa County, Oklahoma |
1.12 |
|
Meade County, South Dakota |
1.12 |
|
Oklahoma County, Oklahoma |
1.1 |
|
Waupaca County, Wisconsin |
1.09 |
|
Adams County, Colorado |
1.07 |
|
DeKalb County, Georgia |
1.05 |
|
Somerset County, Pennsylvania |
1.05 |
|
Fayette County, Pennsylvania |
1.03 |
|
Jefferson County, Colorado |
0.98 |
|
Burleigh County, North Dakota |
0.98 |
|
Marshall County, Iowa |
0.97 |
|
Eastland County, Texas |
0.97 |
|
Vernon Parish, Louisiana |
0.94 |
|
Nelson County, Kentucky |
0.93 |
|
Licking County, Ohio |
0.93 |
|
East Baton Rouge Parish, Louisiana |
0.92 |
|
Ouachita Parish, Louisiana |
0.92 |
|
New Haven County, Connecticut |
0.91 |
|
Androscoggin County, Maine |
0.91 |
|
Dakota County, Minnesota |
0.91 |
|
Carroll County, New Hampshire |
0.91 |
|
Johnson County, Texas |
0.91 |
|
Ward County, North Dakota |
0.9 |
|
Yellowstone County, Montana |
0.89 |
|
Randolph County, North Carolina |
0.89 |
|
Saratoga County, New York |
0.88 |
|
Garrett County, Maryland |
0.87 |
|
Mecklenburg County, North Carolina |
0.87 |
|
Anchorage Borough, Alaska |
0.86 |
|
Hernando County, Florida |
0.86 |
|
Raleigh County, West Virginia |
0.86 |
|
Crawford County, Wisconsin |
0.86 |
|
Carbon County, Wyoming |
0.86 |
|
Hennepin County, Minnesota |
0.85 |
|
Union County, New Jersey |
0.83 |
|
Ellis County, Texas |
0.81 |
|
Hidalgo County, Texas |
0.8 |
|
Deschutes County, Oregon |
0.79 |
|
Penobscot County, Maine |
0.78 |
|
Barnstable County, Massachusetts |
0.78 |
|
Lubbock County, Texas |
0.78 |
|
Fairfield County, Connecticut |
0.77 |
|
Jefferson Parish, Louisiana |
0.76 |
|
Hancock County, Maine |
0.75 |
|
Berkshire County, Massachusetts |
0.75 |
|
Dallas County, Texas |
0.75 |
|
Floyd County, Indiana |
0.74 |
|
Orleans County, New York |
0.74 |
|
Buncombe County, North Carolina |
0.74 |
|
Benton County, Arkansas |
0.73 |
|
Washington County, Pennsylvania |
0.73 |
|
Providence County, Rhode Island |
0.73 |
|
Anne Arundel County, Maryland |
0.72 |
|
Franklin County, Ohio |
0.72 |
|
Monmouth County, New Jersey |
0.71 |
|
Weld County, Colorado |
0.69 |
|
Polk County, Florida |
0.69 |
|
Allegheny County, Pennsylvania |
0.69 |
|
Richmond City, Virginia |
0.69 |
|
Clark County, Indiana |
0.68 |
|
New Hanover County, North Carolina |
0.68 |
|
Berks County, Pennsylvania |
0.68 |
|
Bartholomew County, Indiana |
0.67 |
|
Boone County, Kentucky |
0.67 |
|
Bristol County, Massachusetts |
0.67 |
|
Denton County, Texas |
0.67 |
|
Ventura County, California |
0.66 |
|
Hamilton County, Ohio |
0.66 |
|
Galveston County, Texas |
0.66 |
|
Windham County, Connecticut |
0.65 |
|
Suffolk County, Massachusetts |
0.65 |
|
Stark County, Ohio |
0.65 |
|
Bucks County, Pennsylvania |
0.65 |
|
Prince George's County, Maryland |
0.64 |
|
Washington County, Rhode Island |
0.64 |
|
Cumberland County, Maine |
0.63 |
|
Oakland County, Michigan |
0.63 |
|
Washtenaw County, Michigan |
0.63 |
|
Clark County, Nevada |
0.63 |
|
Adams County, Pennsylvania |
0.63 |
|
Livingston Parish, Louisiana |
0.62 |
|
Morris County, New Jersey |
0.62 |
|
Pocahontas County, Iowa |
0.61 |
|
Craven County, North Carolina |
0.61 |
|
Unknown Or Undefined, Texas |
0.6 |
|
Orleans County, Vermont |
0.6 |
|
Marion County, Florida |
0.58 |
|
Erie County, New York |
0.58 |
|
Unknown Or Undefined, Illinois |
0.55 |
|
Stephens County, Oklahoma |
0.54 |
|
Collin County, Texas |
0.54 |
|
Montgomery County, Texas |
0.54 |
|
Burlington County, New Jersey |
0.53 |
|
Butler County, Ohio |
0.53 |
|
Lancaster County, Pennsylvania |
0.52 |
|
Webb County, Texas |
0.51 |
|
Pinellas County, Florida |
0.49 |
|
Lorain County, Ohio |
0.48 |
|
Unknown Or Undefined, Louisiana |
0.47 |
|
Tarrant County, Texas |
0.47 |
|
Unknown Or Undefined, Minnesota |
0.45 |
|
Unknown Or Undefined, Ohio |
0.45 |
|
Cameron County, Texas |
0.44 |
|
Middlesex County, Massachusetts |
0.42 |
|
Cass County, North Dakota |
0.42 |
|
Riverside County, California |
0.4 |
|
Sacramento County, California |
0.38 |
|
Gwinnett County, Georgia |
0.38 |
|
Essex County, Massachusetts |
0.37 |
|
Essex County, New Jersey |
0.37 |
|
Brazoria County, Texas |
0.37 |
|
Kern County, California |
0.36 |
|
Multnomah County, Oregon |
0.36 |
|
Spartanburg County, South Carolina |
0.36 |
|
Ascension Parish, Louisiana |
0.35 |
|
Madison County, New York |
0.35 |
|
Bell County, Texas |
0.35 |
|
Cook County, Illinois |
0.34 |
|
Hartford County, Connecticut |
0.33 |
|
Santa Fe County, New Mexico |
0.33 |
|
Minnehaha County, South Dakota |
0.33 |
|
Smith County, Texas |
0.33 |
|
Pierce County, Washington |
0.33 |
|
Franklin County, Pennsylvania |
0.32 |
|
Middlesex County, New Jersey |
0.3 |
|
Unknown Or Undefined, New Jersey |
0.3 |
|
Greenville County, South Carolina |
0.28 |
|
Spokane County, Washington |
0.28 |
|
Hanover County, Virginia |
0.26 |
|
Orleans Parish, Louisiana |
0.25 |
|
Cumberland County, Pennsylvania |
0.25 |
|
Travis County, Texas |
0.25 |
|
Blount County, Tennessee |
0.24 |
|
Orange County, Florida |
0.23 |
|
Norfolk County, Massachusetts |
0.23 |
|
Loudoun County, Virginia |
0.23 |
|
San Diego County, California |
0.22 |
|
Unknown Or Undefined, South Carolina |
0.22 |
|
Fresno County, California |
0.21 |
|
Lafayette Parish, Louisiana |
0.21 |
|
Unknown Or Undefined, California |
0.2 |
|
Cecil County, Maryland |
0.2 |
|
Lane County, Oregon |
0.2 |
|
Alachua County, Florida |
0.18 |
|
Unknown Or Undefined, New Hampshire |
0.18 |
|
Nassau County, New York |
0.18 |
|
Unknown Or Undefined, Michigan |
0.17 |
|
Suffolk County, New York |
0.16 |
|
Unknown Or Undefined, Pennsylvania |
0.16 |
|
Contra Costa County, California |
0.15 |
|
San Francisco County, California |
0.15 |
|
Solano County, California |
0.13 |
|
Unknown Or Undefined, Indiana |
0.13 |
|
Unknown Or Undefined, North Carolina |
0.13 |
|
Bexar County, Texas |
0.11 |
|
Placer County, California |
0.09 |
|
Alameda County, California |
0.08 |
|
Unknown Or Undefined, Massachusetts |
0.06 |
|
Unknown Or Undefined, Florida |
0.03 |
|
Source: U.S. Bureau of Labor Statistics, Quarterly Census of Employment and Wages. |
|
| Occupation | Percent of occupation in electric power generation, transmission and distribution | Total employment | Employment in electric power generation, transmission and distribution |
|---|---|---|---|
| Power plant operators | 70.0 | 37,510 | 26,240 |
| Electrical and electronics repairers, powerhouse, substation, and relay | 65.3 | 23,070 | 15,060 |
| Nuclear technicians | 64.9 | 6,500 | 4,220 |
| Power distributors and dispatchers | 61.3 | 11,540 | 7,070 |
| Electrical power-line installers and repairers | 48.8 | 115,380 | 56,270 |
| Nuclear engineers | 43.0 | 16,880 | 7,250 |
| Source: U.S. Bureau of Labor Statistics, Occupational Employment Statistics. | |||
| Area | Location quotient |
|---|---|
|
Balance of Alaska nonmetropolitan area |
20.07 |
|
Central-Southeast Wyoming nonmetropolitan area |
13.92 |
|
Northeast Wyoming nonmetropolitan area |
11.74 |
|
West Central North Dakota nonmetropolitan area |
11.39 |
|
Southwest Alabama nonmetropolitan area |
10.86 |
|
Eastern Utah nonmetropolitan area |
10.01 |
|
Northern West Virginia nonmetropolitan area |
9.29 |
|
Northeast Minnesota nonmetropolitan area |
9.27 |
|
Western Pennsylvania nonmetropolitan area |
9.08 |
|
Low Country South Carolina nonmetropolitan area |
7.03 |
Note: The North American Industry Classification System groups this industry under “aerospace product and parts manufacturing.”
| County | Location quotient |
|---|---|
|
Snohomish County, Washington |
45.35 |
|
Sedgwick County, Kansas |
31.38 |
|
Middlesex County, Connecticut |
10.9 |
|
King County, Washington |
9.98 |
|
Hartford County, Connecticut |
8.55 |
|
Madison County, Alabama |
7.48 |
|
Delaware County, Pennsylvania |
7 |
|
Tarrant County, Texas |
6.68 |
|
Essex County, Massachusetts |
6.6 |
|
Bonner County, Idaho |
6.18 |
| Source: U.S. Bureau of Labor Statistics, Quarterly Census of Employment and Wages. | |

| County | Location quotient |
|---|---|
|
Snohomish County, Washington |
45.35 |
|
Sedgwick County, Kansas |
31.38 |
|
Middlesex County, Connecticut |
10.9 |
|
King County, Washington |
9.98 |
|
Hartford County, Connecticut |
8.55 |
|
Madison County, Alabama |
7.48 |
|
Delaware County, Pennsylvania |
7 |
|
Tarrant County, Texas |
6.68 |
|
Essex County, Massachusetts |
6.6 |
|
Bonner County, Idaho |
6.18 |
|
Okaloosa County, Florida |
5.28 |
|
Harrison County, West Virginia |
5.13 |
|
Butler County, Kansas |
4.81 |
|
Miami County, Ohio |
4.79 |
|
Davis County, Utah |
4.65 |
|
Butler County, Ohio |
4.41 |
|
Garland County, Arkansas |
4.4 |
|
Hamilton County, Ohio |
4.09 |
|
McLennan County, Texas |
3.74 |
|
Muscogee County, Georgia |
3.54 |
|
Lake County, Ohio |
3.48 |
|
St. Charles County, Missouri |
3.22 |
|
Brevard County, Florida |
3.17 |
|
Tulsa County, Oklahoma |
3.13 |
|
Santa Barbara County, California |
2.62 |
|
Pierce County, Washington |
2.6 |
|
Los Angeles County, California |
2.58 |
|
San Diego County, California |
2.39 |
|
Weber County, Utah |
2.34 |
|
St. Joseph County, Indiana |
2.29 |
|
Carson City, Nevada |
2.25 |
|
Maricopa County, Arizona |
2.2 |
|
Boone County, Kentucky |
2.2 |
|
Orange County, California |
2.15 |
|
Marion County, Indiana |
2.06 |
|
Cambria County, Pennsylvania |
1.99 |
|
Harvey County, Kansas |
1.97 |
|
Lorain County, Ohio |
1.91 |
|
Logan County, Oklahoma |
1.72 |
|
Palm Beach County, Florida |
1.59 |
|
Litchfield County, Connecticut |
1.58 |
|
Spokane County, Washington |
1.22 |
|
Johnson County, Texas |
1.15 |
|
Dallas County, Texas |
1.12 |
|
Bexar County, Texas |
1.11 |
|
Summit County, Ohio |
1.09 |
|
Pontotoc County, Oklahoma |
1.05 |
|
Arapahoe County, Colorado |
0.96 |
|
Denton County, Texas |
0.95 |
|
Salt Lake County, Utah |
0.95 |
|
Houston County, Georgia |
0.93 |
|
Deschutes County, Oregon |
0.91 |
|
Belknap County, New Hampshire |
0.86 |
|
Middlesex County, Massachusetts |
0.84 |
|
Unknown Or Undefined, Kansas |
0.81 |
|
Montgomery County, Alabama |
0.77 |
|
New Haven County, Connecticut |
0.75 |
|
San Bernardino County, California |
0.72 |
|
Yavapai County, Arizona |
0.71 |
|
Duval County, Florida |
0.71 |
|
Suffolk County, New York |
0.71 |
|
Ventura County, California |
0.7 |
|
Kern County, California |
0.59 |
|
Cuyahoga County, Ohio |
0.58 |
|
Manatee County, Florida |
0.56 |
|
Bucks County, Pennsylvania |
0.53 |
|
Nassau County, New York |
0.52 |
|
Mohave County, Arizona |
0.5 |
|
Macomb County, Michigan |
0.48 |
|
Broward County, Florida |
0.45 |
|
Oakland County, Michigan |
0.42 |
|
Utah County, Utah |
0.42 |
|
Gillespie County, Texas |
0.37 |
|
Bernalillo County, New Mexico |
0.36 |
|
Riverside County, California |
0.35 |
|
Montgomery County, Ohio |
0.35 |
|
Santa Cruz County, California |
0.34 |
|
Pinellas County, Florida |
0.33 |
|
Winnebago County, Wisconsin |
0.31 |
|
Miami-Dade County, Florida |
0.3 |
|
Escambia County, Florida |
0.29 |
|
Lucas County, Ohio |
0.29 |
|
Racine County, Wisconsin |
0.28 |
|
Unknown Or Undefined, Florida |
0.27 |
|
Unknown Or Undefined, California |
0.26 |
|
Chittenden County, Vermont |
0.26 |
|
Highlands County, Florida |
0.24 |
|
Queens County, New York |
0.24 |
|
Unknown Or Undefined, Oklahoma |
0.21 |
|
Dakota County, Minnesota |
0.19 |
|
Bergen County, New Jersey |
0.19 |
|
Anoka County, Minnesota |
0.17 |
|
Lane County, Oregon |
0.16 |
|
Wayne County, Michigan |
0.15 |
|
Harris County, Texas |
0.15 |
|
Richmond County, Georgia |
0.13 |
|
Unknown Or Undefined, Idaho |
0.13 |
|
DuPage County, Illinois |
0.13 |
|
Alameda County, California |
0.12 |
|
Boulder County, Colorado |
0.12 |
|
New Castle County, Delaware |
0.12 |
|
Unknown Or Undefined, South Carolina |
0.11 |
|
Caddo Parish, Louisiana |
0.09 |
|
Unknown Or Undefined, Texas |
0.09 |
|
Seminole County, Florida |
0.08 |
|
Kootenai County, Idaho |
0.08 |
|
Volusia County, Florida |
0.07 |
|
Unknown Or Undefined, Ohio |
0.06 |
|
Milwaukee County, Wisconsin |
0.06 |
|
Cook County, Illinois |
0.05 |
|
Washtenaw County, Michigan |
0.05 |
|
Fulton County, Georgia |
0.04 |
|
Unknown Or Undefined, Michigan |
0.04 |
|
Iredell County, North Carolina |
0.04 |
|
Wake County, North Carolina |
0.04 |
|
Polk County, Florida |
0.03 |
|
Unknown Or Undefined, Georgia |
0.03 |
|
Ada County, Idaho |
0.02 |
|
Unknown Or Undefined, Illinois |
0.02 |
|
Jefferson County, Alabama |
0.01 |
|
Hennepin County, Minnesota |
0.01 |
|
Unknown Or Undefined, New York |
0.01 |
|
Arlington County, Virginia |
0.01 |
|
Source: U.S. Bureau of Labor Statistics, Quarterly Census of Employment and Wages. |
|
| Occupation | Percent of occupation in aerospace product and parts manufacturing | Total employment | Employment in aerospace product and parts manufacturing |
|---|---|---|---|
| Aircraft structure, surfaces, rigging, and systems assemblers | 91.4 | 42,810 | 39,110 |
| Aerospace engineers | 40.1 | 66,980 | 26,840 |
| Aerospace engineering and operations technicians | 33.7 | 12,890 | 4,340 |
| Avionics technicians | 30.5 | 17,340 | 5,290 |
| Materials engineers | 13.1 | 27,040 | 3,530 |
| Industrial engineers | 8.3 | 247,570 | 20,470 |
| Source: U.S. Bureau of Labor Statistics, Occupational Employment Statistics. | |||
| Area | Location quotient |
|---|---|
|
Fort Worth-Arlington, Texas Metropolitan Division |
3.80 |
|
Jacksonville, Florida |
1.67 |
|
Bend-Redmond, Oregon |
1.54 |
|
Huntsville, Alabama |
1.27 |
|
Phoenix-Mesa-Scottsdale, Arizona |
1.11 |
|
San Jose-Sunnyvale-Santa Clara, California |
0.91 |
|
Anaheim-Santa Ana-Irvine, California Metropolitan Division |
0.84 |
|
Salt Lake City, Utah |
0.80 |
|
Los Angeles-Long Beach-Glendale, California Metropolitan Division |
0.70 |
|
Ogden-Clearfield, Utah |
0.58 |
| Source: U.S. Bureau of Labor Statistics, Occupational Employment Statistics. | |
Note: The North American Industry Classification System groups this industry under “wood product manufacturing.”
| County | Location quotient |
|---|---|
|
Winston County, Alabama |
97.94 |
|
Smith County, Mississippi |
89.69 |
|
Rusk County, Wisconsin |
70.08 |
|
Wayne County, Kentucky |
61.46 |
|
Pickens County, Alabama |
60.08 |
|
Allendale County, South Carolina |
58.93 |
|
Shannon County, Missouri |
55.86 |
|
Florence County, Wisconsin |
55.19 |
|
Reynolds County, Missouri |
55.03 |
|
Sabine Parish, Louisiana |
53.03 |
| Source: U.S. Bureau of Labor Statistics, Quarterly Census of Employment and Wages. | |

| County | Location quotient |
|---|---|
|
Winston County, Alabama |
97.94 |
|
Smith County, Mississippi |
89.69 |
|
Rusk County, Wisconsin |
70.08 |
|
Wayne County, Kentucky |
61.46 |
|
Pickens County, Alabama |
60.08 |
|
Allendale County, South Carolina |
58.93 |
|
Shannon County, Missouri |
55.86 |
|
Florence County, Wisconsin |
55.19 |
|
Reynolds County, Missouri |
55.03 |
|
Sabine Parish, Louisiana |
53.03 |
|
Bradley County, Arkansas |
51.63 |
|
Lewis County, Idaho |
50.37 |
|
Winn Parish, Louisiana |
48.56 |
|
Jeff Davis County, Georgia |
48.48 |
|
Monroe County, Kentucky |
47.12 |
|
Dallas County, Arkansas |
46.75 |
|
Calhoun County, Mississippi |
45.42 |
|
Patrick County, Virginia |
45.05 |
|
Webster County, West Virginia |
44.25 |
|
Franklin County, Virginia |
44.05 |
|
Clarke County, Alabama |
42.1 |
|
Noxubee County, Mississippi |
40.63 |
|
Charlotte County, Virginia |
39.46 |
|
Iron County, Wisconsin |
39.21 |
|
Montgomery County, North Carolina |
38.6 |
|
Wilkinson County, Mississippi |
38.22 |
|
Taylor County, Wisconsin |
37.52 |
|
Clark County, Arkansas |
37 |
|
Juniata County, Pennsylvania |
36.84 |
|
Amite County, Mississippi |
35.63 |
|
Boundary County, Idaho |
35.34 |
|
Randolph County, West Virginia |
33.84 |
|
Marion County, Alabama |
32.53 |
|
Washington County, Idaho |
32.48 |
|
Pocahontas County, West Virginia |
31.39 |
|
Columbia County, Arkansas |
31.16 |
|
Stone County, Mississippi |
30.83 |
|
Turner County, Georgia |
30.76 |
|
Marion County, Texas |
30.49 |
|
Searcy County, Arkansas |
30.37 |
|
Oregon County, Missouri |
30.27 |
|
Crook County, Oregon |
30.09 |
|
Douglas County, Oregon |
30.02 |
|
Walthall County, Mississippi |
29.95 |
|
Lake County, Oregon |
29.75 |
|
Choctaw County, Mississippi |
29.2 |
|
Snyder County, Pennsylvania |
28.95 |
|
Price County, Wisconsin |
28.09 |
|
Wayne County, Tennessee |
27.59 |
|
Izard County, Arkansas |
27.54 |
|
Vinton County, Ohio |
27.01 |
|
Clarion County, Pennsylvania |
26.64 |
|
Monroe County, Alabama |
26.57 |
|
Lewis County, Washington |
26.22 |
|
Bibb County, Alabama |
26.1 |
|
Pierce County, Georgia |
25.94 |
|
Carter County, Missouri |
25.87 |
|
Warren County, North Carolina |
25.65 |
|
Grant County, Arkansas |
25.57 |
|
Macon County, Tennessee |
25.11 |
|
Marion County, Kentucky |
24.66 |
|
Lagrange County, Indiana |
24.56 |
|
Bamberg County, South Carolina |
24.24 |
|
McCurtain County, Oklahoma |
24.11 |
|
Braxton County, West Virginia |
24.11 |
|
Holmes County, Ohio |
24 |
|
Wilkes County, Georgia |
23.5 |
|
Ben Hill County, Georgia |
23.32 |
|
Brantley County, Georgia |
23.01 |
|
Wayne County, Mississippi |
22.92 |
|
Hot Spring County, Arkansas |
22.64 |
|
Amelia County, Virginia |
22.61 |
|
Red River County, Texas |
22.6 |
|
Missaukee County, Michigan |
22.03 |
|
Pike County, Ohio |
21.84 |
|
Forest County, Wisconsin |
21.7 |
|
Lewis County, Kentucky |
21.59 |
|
Lawrence County, Mississippi |
21.54 |
|
Cass County, Michigan |
21.15 |
|
Grant County, West Virginia |
20.56 |
|
Casey County, Kentucky |
20.41 |
|
Stevens County, Washington |
20.17 |
|
Howell County, Missouri |
19.69 |
|
Todd County, Kentucky |
19.68 |
|
Pike County, Arkansas |
19.67 |
|
Essex County, Virginia |
19.62 |
|
Chatham County, North Carolina |
19.57 |
|
Sawyer County, Wisconsin |
19.31 |
|
Alexander County, Illinois |
19.28 |
|
Nicholas County, West Virginia |
19.13 |
|
Drew County, Arkansas |
19.08 |
|
Lamar County, Alabama |
19.02 |
|
Bradford County, Pennsylvania |
18.78 |
|
Ashland County, Wisconsin |
18.56 |
|
Oxford County, Maine |
18.37 |
|
Klamath County, Oregon |
18.36 |
|
Grays Harbor County, Washington |
18.23 |
|
Fayette County, Alabama |
18.17 |
|
Upshur County, West Virginia |
18.13 |
|
Marengo County, Alabama |
17.91 |
|
Mingo County, West Virginia |
17.67 |
|
Richmond County, Virginia |
17.59 |
|
Dent County, Missouri |
17.37 |
|
Chilton County, Alabama |
17.33 |
|
Pulaski County, Kentucky |
17.06 |
|
Bollinger County, Missouri |
17.02 |
|
Mineral County, West Virginia |
16.95 |
|
Pushmataha County, Oklahoma |
16.89 |
|
Washburn County, Wisconsin |
16.68 |
|
Lincoln County, Wisconsin |
16.65 |
|
Cumberland County, Kentucky |
16.51 |
|
Gogebic County, Michigan |
16.39 |
|
Sanders County, Montana |
16.14 |
|
Potter County, Pennsylvania |
16.1 |
|
Douglas County, Illinois |
16.01 |
|
Crawford County, Wisconsin |
15.95 |
|
San Augustine County, Texas |
15.77 |
|
Cherokee County, Texas |
15.58 |
|
Washington County, Indiana |
15.53 |
|
King William County, Virginia |
15.36 |
|
Hardin County, Tennessee |
15.34 |
|
Newberry County, South Carolina |
15.12 |
|
Iron County, Michigan |
15.04 |
|
Granite County, Montana |
15.04 |
|
Tillamook County, Oregon |
15.04 |
|
Galax City, Virginia |
15.04 |
|
Coos County, Oregon |
14.82 |
|
Ware County, Georgia |
14.74 |
|
Ripley County, Missouri |
14.74 |
|
Crawford County, Missouri |
14.65 |
|
Washington County, North Carolina |
14.58 |
|
Fleming County, Kentucky |
14.54 |
|
Madison County, Arkansas |
14.5 |
|
Kewaunee County, Wisconsin |
14.29 |
|
Dickinson County, Michigan |
14.27 |
|
Ohio County, Kentucky |
14.23 |
|
Caroline County, Virginia |
14.11 |
|
Linn County, Oregon |
13.89 |
|
Shawano County, Wisconsin |
13.86 |
|
Redwood County, Minnesota |
13.59 |
|
Menominee County, Michigan |
13.53 |
|
Rusk County, Texas |
13.49 |
|
Langlade County, Wisconsin |
13.46 |
|
Southampton County, Virginia |
13.3 |
|
White County, Tennessee |
13.21 |
|
Hardeman County, Tennessee |
13.16 |
|
Richland County, North Dakota |
12.96 |
|
Waldo County, Maine |
12.94 |
|
Mifflin County, Pennsylvania |
12.87 |
|
Putnam County, Georgia |
12.57 |
|
Polk County, Arkansas |
12.54 |
|
New Kent County, Virginia |
12.51 |
|
Mason County, Washington |
12.45 |
|
Escambia County, Alabama |
12.44 |
|
Union County, Arkansas |
12.44 |
|
Nottoway County, Virginia |
12.19 |
|
McDowell County, North Carolina |
12.1 |
|
Aroostook County, Maine |
12.09 |
|
Wilkes County, North Carolina |
11.77 |
|
Houston County, Tennessee |
11.76 |
|
Orange County, Virginia |
11.67 |
|
Barbour County, Alabama |
11.54 |
|
Marathon County, Wisconsin |
11.51 |
|
Bonner County, Idaho |
11.47 |
|
Scott County, Tennessee |
11.43 |
|
Madison County, Missouri |
11.33 |
|
Stone County, Arkansas |
11.24 |
|
Fulton County, Indiana |
11.21 |
|
Union County, Pennsylvania |
11.21 |
|
Brunswick County, Virginia |
11.21 |
|
Lunenburg County, Virginia |
10.95 |
|
Perry County, Missouri |
10.88 |
|
Somerset County, Maine |
10.81 |
|
Johnson County, Tennessee |
10.72 |
|
Tucker County, West Virginia |
10.68 |
|
Claiborne County, Mississippi |
10.66 |
|
Carroll County, Missouri |
10.65 |
|
Lincoln County, Mississippi |
10.48 |
|
Preston County, West Virginia |
10.31 |
|
Decatur County, Tennessee |
10.27 |
|
Piscataquis County, Maine |
10.21 |
|
Owen County, Indiana |
10.2 |
|
Warren County, Mississippi |
10.11 |
|
Stanly County, North Carolina |
10.1 |
|
Benton County, Tennessee |
10.07 |
|
Davidson County, North Carolina |
10.03 |
|
Mckean County, Pennsylvania |
10.03 |
|
Lincoln County, Kentucky |
9.98 |
|
Colquitt County, Georgia |
9.93 |
|
Jackson County, Florida |
9.84 |
|
Presque Isle County, Michigan |
9.83 |
|
Hardin County, Texas |
9.79 |
|
Hart County, Kentucky |
9.78 |
|
Hickman County, Tennessee |
9.75 |
|
Columbia County, Oregon |
9.64 |
|
Alleghany County, Virginia |
9.64 |
|
Trigg County, Kentucky |
9.63 |
|
Nacogdoches County, Texas |
9.62 |
|
Harrison County, Indiana |
9.54 |
|
Oscoda County, Michigan |
9.5 |
|
McNairy County, Tennessee |
9.43 |
|
Marinette County, Wisconsin |
9.42 |
|
Jasper County, Texas |
9.4 |
|
Greenup County, Kentucky |
9.36 |
|
Schuylkill County, Pennsylvania |
9.32 |
|
Clark County, Wisconsin |
9.31 |
|
Jackson County, Oregon |
9.29 |
|
Blackford County, Indiana |
9.26 |
|
Thomas County, Georgia |
9.25 |
|
Hubbard County, Minnesota |
9.19 |
|
Pittsylvania County, Virginia |
9.15 |
|
Upson County, Georgia |
9.12 |
|
Flathead County, Montana |
9.08 |
|
Josephine County, Oregon |
9.08 |
|
Cowlitz County, Washington |
9.01 |
|
Scotland County, Missouri |
8.94 |
|
Jefferson County, Tennessee |
8.92 |
|
Ouachita County, Arkansas |
8.89 |
|
Scott County, Missouri |
8.89 |
|
Elkhart County, Indiana |
8.87 |
|
Jefferson County, Pennsylvania |
8.82 |
|
Dubuque County, Iowa |
8.78 |
|
Colleton County, South Carolina |
8.77 |
|
Rockbridge County, Virginia |
8.5 |
|
Hampshire County, West Virginia |
8.36 |
|
Branch County, Michigan |
8.31 |
|
Buckingham County, Virginia |
8.3 |
|
Alpena County, Michigan |
8.29 |
|
Lawrence County, Arkansas |
8.26 |
|
Davie County, North Carolina |
8.23 |
|
Smyth County, Virginia |
8.23 |
|
Pike County, Mississippi |
8.21 |
|
Wadena County, Minnesota |
8.16 |
|
Dallas County, Alabama |
8.15 |
|
Marion County, Tennessee |
8.15 |
|
Lane County, Oregon |
8.14 |
|
Warren County, Tennessee |
8.12 |
|
Harrison County, Texas |
8.07 |
|
Wilcox County, Alabama |
8.04 |
|
Dodge County, Nebraska |
8.04 |
|
Muhlenberg County, Kentucky |
8.02 |
|
Rapides Parish, Louisiana |
8 |
|
Dunn County, Wisconsin |
7.93 |
|
Louisa County, Virginia |
7.9 |
|
Hempstead County, Arkansas |
7.89 |
|
Barton County, Missouri |
7.87 |
|
Clay County, Indiana |
7.82 |
|
Lawrence County, South Dakota |
7.82 |
|
Benton County, Iowa |
7.81 |
|
Siskiyou County, California |
7.79 |
|
Grenada County, Mississippi |
7.75 |
|
Lincoln Parish, Louisiana |
7.74 |
|
Franklin County, Maine |
7.71 |
|
Rowan County, Kentucky |
7.68 |
|
Yamhill County, Oregon |
7.66 |
|
Clinton County, Missouri |
7.65 |
|
Rutherford County, North Carolina |
7.64 |
|
Washington County, Missouri |
7.54 |
|
Adair County, Kentucky |
7.45 |
|
Alcona County, Michigan |
7.4 |
|
Howard County, Texas |
7.31 |
|
Wyoming County, Pennsylvania |
7.29 |
|
Boone County, Illinois |
7.27 |
|
Carroll County, Virginia |
7.27 |
|
Marshall County, Indiana |
7.23 |
|
Morrow County, Oregon |
7.23 |
|
Crawford County, Pennsylvania |
7.19 |
|
Franklin County, Alabama |
7.12 |
|
Texas County, Missouri |
7.04 |
|
Barron County, Wisconsin |
7.03 |
|
Danville City, Virginia |
7.02 |
|
Colbert County, Alabama |
6.97 |
|
Tioga County, New York |
6.92 |
|
Laurens County, South Carolina |
6.9 |
|
Abbeville County, South Carolina |
6.88 |
|
Wood County, Wisconsin |
6.86 |
|
Columbia County, Florida |
6.83 |
|
Clearfield County, Pennsylvania |
6.83 |
|
Greenbrier County, West Virginia |
6.82 |
|
Noble County, Indiana |
6.79 |
|
Clark County, Indiana |
6.64 |
|
Vilas County, Wisconsin |
6.63 |
|
Giles County, Tennessee |
6.62 |
|
Franklin County, North Carolina |
6.59 |
|
Neosho County, Kansas |
6.56 |
|
Hunt County, Texas |
6.56 |
|
Daviess County, Indiana |
6.53 |
|
Fentress County, Tennessee |
6.52 |
|
Lincoln County, Tennessee |
6.43 |
|
LaSalle Parish, Louisiana |
6.35 |
|
Little River County, Arkansas |
6.32 |
|
Isabella County, Michigan |
6.32 |
|
Perry County, Pennsylvania |
6.31 |
|
Garrett County, Maryland |
6.29 |
|
Tuscarawas County, Ohio |
6.23 |
|
Gilmer County, Georgia |
6.2 |
|
Wilkinson County, Georgia |
6.15 |
|
Houston County, Minnesota |
6.12 |
|
Bedford County, Pennsylvania |
6.1 |
|
Cass County, Minnesota |
6.09 |
|
Yancey County, North Carolina |
6.09 |
|
Okanogan County, Washington |
6.04 |
|
Adams County, Indiana |
5.98 |
|
Henry County, Tennessee |
5.98 |
|
Clay County, Arkansas |
5.97 |
|
Coffee County, Georgia |
5.92 |
|
Fayette County, Illinois |
5.89 |
|
Windsor County, Vermont |
5.86 |
|
Halifax County, Virginia |
5.84 |
|
Moultrie County, Illinois |
5.81 |
|
Knox County, Kentucky |
5.81 |
|
Wayne County, Ohio |
5.81 |
|
Floyd County, Indiana |
5.78 |
|
Montezuma County, Colorado |
5.62 |
|
Morgan County, Indiana |
5.62 |
|
Wayne County, Missouri |
5.61 |
|
Alexander County, North Carolina |
5.61 |
|
Skagit County, Washington |
5.61 |
|
Angelina County, Texas |
5.58 |
|
East Feliciana Parish, Louisiana |
5.57 |
|
Cumberland County, Tennessee |
5.57 |
|
Laurel County, Kentucky |
5.55 |
|
Mendocino County, California |
5.52 |
|
Moniteau County, Missouri |
5.52 |
|
Macon County, Georgia |
5.5 |
|
Waupaca County, Wisconsin |
5.48 |
|
Graham County, North Carolina |
5.47 |
|
Greenwood County, South Carolina |
5.47 |
|
Davis County, Iowa |
5.45 |
|
Ravalli County, Montana |
5.42 |
|
Campbell County, Virginia |
5.39 |
|
Johnson County, Texas |
5.38 |
|
Fayette County, Tennessee |
5.37 |
|
Canyon County, Idaho |
5.35 |
|
Hamblen County, Tennessee |
5.33 |
|
Chambers County, Alabama |
5.29 |
|
Union County, North Carolina |
5.29 |
|
Chenango County, New York |
5.26 |
|
Humboldt County, California |
5.25 |
|
Rush County, Indiana |
5.25 |
|
Iowa County, Wisconsin |
5.25 |
|
Shelby County, Texas |
5.21 |
|
Cheatham County, Tennessee |
5.18 |
|
Douglas County, Missouri |
5.15 |
|
Effingham County, Georgia |
5.14 |
|
Washington Parish, Louisiana |
5.14 |
|
Caldwell County, North Carolina |
5.05 |
|
Barbour County, West Virginia |
5.04 |
|
Huntingdon County, Pennsylvania |
5.03 |
|
Logan County, Kentucky |
5 |
|
Lebanon County, Pennsylvania |
4.99 |
|
Clallam County, Washington |
4.97 |
|
Franklin County, Georgia |
4.96 |
|
Delaware County, Iowa |
4.96 |
|
Davison County, South Dakota |
4.95 |
|
Prentiss County, Mississippi |
4.92 |
|
Jackson County, Georgia |
4.91 |
|
Itawamba County, Mississippi |
4.91 |
|
Walker County, Texas |
4.89 |
|
Overton County, Tennessee |
4.88 |
|
Marion County, Arkansas |
4.85 |
|
Union Parish, Louisiana |
4.85 |
|
Grand County, Colorado |
4.82 |
|
Jackson County, Alabama |
4.77 |
|
Roanoke County, Virginia |
4.76 |
|
Winston County, Mississippi |
4.74 |
|
Crawford County, Indiana |
4.73 |
|
Morgan County, Alabama |
4.72 |
|
Whatcom County, Washington |
4.69 |
|
Marlboro County, South Carolina |
4.68 |
|
Green County, Kentucky |
4.65 |
|
Clinton County, Illinois |
4.64 |
|
Wyoming County, New York |
4.64 |
|
Crittenden County, Kentucky |
4.62 |
|
Graves County, Kentucky |
4.62 |
|
Newton County, Arkansas |
4.61 |
|
Lyon County, Minnesota |
4.6 |
|
White County, Georgia |
4.59 |
|
Trempealeau County, Wisconsin |
4.59 |
|
Grundy County, Tennessee |
4.57 |
|
Walker County, Alabama |
4.53 |
|
Macon County, North Carolina |
4.53 |
|
Deschutes County, Oregon |
4.53 |
|
Bradford County, Florida |
4.52 |
|
Wabasha County, Minnesota |
4.48 |
|
Pope County, Arkansas |
4.47 |
|
Juneau County, Wisconsin |
4.46 |
|
Doniphan County, Kansas |
4.43 |
|
Adams County, Ohio |
4.42 |
|
Stewart County, Tennessee |
4.42 |
|
Caldwell County, Kentucky |
4.4 |
|
Delaware County, New York |
4.37 |
|
Umatilla County, Oregon |
4.37 |
|
Switzerland County, Indiana |
4.31 |
|
Fayette County, Ohio |
4.27 |
|
Windham County, Vermont |
4.24 |
|
Sullivan County, New Hampshire |
4.22 |
|
Hocking County, Ohio |
4.2 |
|
Washington County, New York |
4.19 |
|
Mercer County, Pennsylvania |
4.19 |
|
Fulton County, Pennsylvania |
4.17 |
|
Lincoln County, Montana |
4.14 |
|
Ashtabula County, Ohio |
4.11 |
|
Pasquotank County, North Carolina |
4.06 |
|
Carroll County, Tennessee |
4.05 |
|
Mecklenburg County, Virginia |
4.01 |
|
Hamilton County, Illinois |
3.98 |
|
Jackson County, Ohio |
3.98 |
|
Northumberland County, Pennsylvania |
3.98 |
|
Culpeper County, Virginia |
3.96 |
|
Marshall County, Alabama |
3.95 |
|
Yuba County, California |
3.92 |
|
Buffalo County, Wisconsin |
3.92 |
|
Osage County, Missouri |
3.91 |
|
Pike County, Missouri |
3.9 |
|
Montgomery County, Kentucky |
3.87 |
|
Lake County, Michigan |
3.87 |
|
Coos County, New Hampshire |
3.86 |
|
Nassau County, Florida |
3.85 |
|
Shasta County, California |
3.84 |
|
Burnett County, Wisconsin |
3.83 |
|
Elk County, Pennsylvania |
3.82 |
|
Addison County, Vermont |
3.81 |
|
Grant County, Wisconsin |
3.77 |
|
Richland County, Wisconsin |
3.76 |
|
Lycoming County, Pennsylvania |
3.74 |
|
Manitowoc County, Wisconsin |
3.74 |
|
Cullman County, Alabama |
3.72 |
|
Cattaraugus County, New York |
3.72 |
|
Johnson County, Indiana |
3.69 |
|
Lancaster County, Pennsylvania |
3.68 |
|
Dickson County, Tennessee |
3.67 |
|
Beltrami County, Minnesota |
3.66 |
|
Tuscaloosa County, Alabama |
3.64 |
|
Randolph County, North Carolina |
3.64 |
|
Dubois County, Indiana |
3.61 |
|
Webster County, Missouri |
3.61 |
|
Jasper County, Indiana |
3.59 |
|
Ste. Genevieve County, Missouri |
3.59 |
|
Washington County, Ohio |
3.56 |
|
Catoosa County, Georgia |
3.55 |
|
DeKalb County, Indiana |
3.55 |
|
Henry County, Iowa |
3.52 |
|
Halifax County, North Carolina |
3.51 |
|
Polk County, Wisconsin |
3.51 |
|
Greene County, Illinois |
3.49 |
|
Kootenai County, Idaho |
3.46 |
|
Adams County, Pennsylvania |
3.46 |
|
Saline County, Illinois |
3.45 |
|
Williams County, Ohio |
3.45 |
|
Butte County, South Dakota |
3.43 |
|
Osceola County, Michigan |
3.42 |
|
Wasco County, Oregon |
3.41 |
|
Pontotoc County, Mississippi |
3.4 |
|
Obion County, Tennessee |
3.35 |
|
Hopkins County, Kentucky |
3.33 |
|
Marion County, Oregon |
3.33 |
|
Washington County, Iowa |
3.32 |
|
Tishomingo County, Mississippi |
3.32 |
|
Armstrong County, Pennsylvania |
3.3 |
|
Florence County, South Carolina |
3.29 |
|
Perry County, Indiana |
3.28 |
|
Carroll County, Maryland |
3.28 |
|
Seneca County, Ohio |
3.26 |
|
Cass County, North Dakota |
3.22 |
|
Augusta County, Virginia |
3.2 |
|
Crawford County, Kansas |
3.18 |
|
Hanover County, Virginia |
3.17 |
|
Barren County, Kentucky |
3.15 |
|
Clark County, Ohio |
3.15 |
|
Oconto County, Wisconsin |
3.15 |
|
Itasca County, Minnesota |
3.14 |
|
Morgan County, Missouri |
3.13 |
|
Hall County, Nebraska |
3.13 |
|
San Benito County, California |
3.09 |
|
Lowndes County, Georgia |
3.09 |
|
Freeborn County, Minnesota |
3.07 |
|
Vernon Parish, Louisiana |
3.06 |
|
Rutland County, Vermont |
3.06 |
|
Monroe County, Mississippi |
3.03 |
|
Chickasaw County, Iowa |
3.02 |
|
Crow Wing County, Minnesota |
3.02 |
|
Bulloch County, Georgia |
3.01 |
|
Warren County, Pennsylvania |
3 |
|
Franklin County, Pennsylvania |
2.99 |
|
McLennan County, Texas |
2.98 |
|
Dodge County, Wisconsin |
2.98 |
|
Randolph County, Arkansas |
2.92 |
|
Polk County, Florida |
2.92 |
|
Surry County, North Carolina |
2.92 |
|
Pennington County, South Dakota |
2.92 |
|
Stephens County, Georgia |
2.91 |
|
Ashe County, North Carolina |
2.91 |
|
Burke County, North Carolina |
2.9 |
|
Scott County, Mississippi |
2.89 |
|
Carter County, Kentucky |
2.87 |
|
Benton County, Oregon |
2.87 |
|
Rowan County, North Carolina |
2.86 |
|
Amherst County, Virginia |
2.86 |
|
Clearwater County, Minnesota |
2.85 |
|
Fayette County, Pennsylvania |
2.85 |
|
Mercer County, West Virginia |
2.85 |
|
Montrose County, Colorado |
2.84 |
|
Lake County, Montana |
2.84 |
|
Herkimer County, New York |
2.8 |
|
Simpson County, Kentucky |
2.79 |
|
Georgetown County, South Carolina |
2.79 |
|
Lincoln County, Missouri |
2.78 |
|
Geauga County, Ohio |
2.78 |
|
Macoupin County, Illinois |
2.77 |
|
Benton County, Missouri |
2.76 |
|
Gem County, Idaho |
2.75 |
|
Jefferson County, Indiana |
2.75 |
|
Orangeburg County, South Carolina |
2.75 |
|
Independence County, Arkansas |
2.74 |
|
Lapeer County, Michigan |
2.74 |
|
Mackinac County, Michigan |
2.73 |
|
Androscoggin County, Maine |
2.7 |
|
Coshocton County, Ohio |
2.7 |
|
Ogemaw County, Michigan |
2.68 |
|
Calhoun County, Alabama |
2.66 |
|
Cook County, Georgia |
2.66 |
|
Spalding County, Georgia |
2.65 |
|
Cheshire County, New Hampshire |
2.65 |
|
Warrick County, Indiana |
2.64 |
|
Bowie County, Texas |
2.63 |
|
Sharp County, Arkansas |
2.62 |
|
Clinton County, Indiana |
2.61 |
|
Mille Lacs County, Minnesota |
2.61 |
|
Essex County, New York |
2.59 |
|
Uinta County, Wyoming |
2.57 |
|
Franklin County, Indiana |
2.55 |
|
Wright County, Minnesota |
2.55 |
|
Gibson County, Tennessee |
2.54 |
|
Cass County, Texas |
2.54 |
|
Clarendon County, South Carolina |
2.47 |
|
Lenawee County, Michigan |
2.46 |
|
Barrow County, Georgia |
2.44 |
|
Madison County, Tennessee |
2.44 |
|
Muskingum County, Ohio |
2.43 |
|
Brown County, Indiana |
2.42 |
|
Lamar County, Mississippi |
2.42 |
|
Anderson County, Tennessee |
2.41 |
|
Randolph County, Missouri |
2.4 |
|
Warren County, New York |
2.39 |
|
Perry County, Illinois |
2.38 |
|
Van Wert County, Ohio |
2.38 |
|
Edgefield County, South Carolina |
2.37 |
|
Spotsylvania County, Virginia |
2.35 |
|
Grafton County, New Hampshire |
2.34 |
|
Licking County, Ohio |
2.34 |
|
Brown County, Ohio |
2.32 |
|
Allegany County, New York |
2.31 |
|
Moore County, North Carolina |
2.31 |
|
DeKalb County, Alabama |
2.29 |
|
McLeod County, Minnesota |
2.28 |
|
Wright County, Missouri |
2.28 |
|
Clinton County, Pennsylvania |
2.28 |
|
Floyd County, Georgia |
2.26 |
|
Nash County, North Carolina |
2.26 |
|
Vance County, North Carolina |
2.26 |
|
Alcorn County, Mississippi |
2.25 |
|
Bartow County, Georgia |
2.24 |
|
Mason County, Michigan |
2.23 |
|
Ripley County, Indiana |
2.21 |
|
Hood River County, Oregon |
2.2 |
|
Somerset County, Pennsylvania |
2.2 |
|
Delta County, Colorado |
2.19 |
|
Barry County, Michigan |
2.19 |
|
Chippewa County, Wisconsin |
2.19 |
|
York County, South Carolina |
2.18 |
|
Humphreys County, Tennessee |
2.18 |
|
Monroe County, Wisconsin |
2.17 |
|
Outagamie County, Wisconsin |
2.17 |
|
Pierce County, Washington |
2.16 |
|
Wayne County, Illinois |
2.13 |
|
Jackson County, Indiana |
2.13 |
|
Screven County, Georgia |
2.11 |
|
Jefferson County, Arkansas |
2.1 |
|
Alamance County, North Carolina |
2.1 |
|
Delta County, Michigan |
2.09 |
|
Baldwin County, Alabama |
2.08 |
|
Orange County, Vermont |
2.08 |
|
Newton County, Mississippi |
2.07 |
|
Missoula County, Montana |
2.07 |
|
Jackson County, Wisconsin |
2.07 |
|
Marion County, Florida |
2.06 |
|
Lauderdale County, Alabama |
2.05 |
|
Livingston Parish, Louisiana |
2.05 |
|
Perry County, Ohio |
2.05 |
|
Tioga County, Pennsylvania |
2.05 |
|
Wayne County, Indiana |
2.02 |
|
Natchitoches Parish, Louisiana |
2.02 |
|
Richland County, Illinois |
2.01 |
|
Eaton County, Michigan |
2.01 |
|
Henry County, Virginia |
2.01 |
|
Crockett County, Tennessee |
2 |
|
La Crosse County, Wisconsin |
1.99 |
|
Navajo County, Arizona |
1.98 |
|
Susquehanna County, Pennsylvania |
1.95 |
|
Orange County, Indiana |
1.94 |
|
Greene County, Indiana |
1.93 |
|
St. Lucie County, Florida |
1.92 |
|
Carroll County, New Hampshire |
1.91 |
|
Clackamas County, Oregon |
1.9 |
|
Portage County, Wisconsin |
1.89 |
|
Beauregard Parish, Louisiana |
1.88 |
|
Lackawanna County, Pennsylvania |
1.88 |
|
Sumter County, Florida |
1.87 |
|
Hancock County, Indiana |
1.85 |
|
Mahoning County, Ohio |
1.85 |
|
Box Elder County, Utah |
1.84 |
|
Penobscot County, Maine |
1.83 |
|
Ottawa County, Michigan |
1.83 |
|
Iron County, Missouri |
1.83 |
|
Grady County, Georgia |
1.82 |
|
Sullivan County, Indiana |
1.82 |
|
Dakota County, Nebraska |
1.82 |
|
St. Joseph County, Michigan |
1.81 |
|
Newton County, Missouri |
1.81 |
|
Edgecombe County, North Carolina |
1.81 |
|
Blair County, Pennsylvania |
1.81 |
|
Wayne County, Pennsylvania |
1.81 |
|
Livingston County, Illinois |
1.8 |
|
Venango County, Pennsylvania |
1.8 |
|
Columbia County, Georgia |
1.76 |
|
Pickens County, South Carolina |
1.76 |
|
Haywood County, North Carolina |
1.75 |
|
Pender County, North Carolina |
1.74 |
|
Darke County, Ohio |
1.74 |
|
Windham County, Connecticut |
1.73 |
|
Christian County, Missouri |
1.72 |
|
Shelby County, Ohio |
1.72 |
|
Lee County, Virginia |
1.72 |
|
Oneida County, Wisconsin |
1.72 |
|
Greene County, Tennessee |
1.71 |
|
Queen Anne's County, Maryland |
1.68 |
|
Sheboygan County, Wisconsin |
1.68 |
|
Nevada County, Arkansas |
1.67 |
|
San Joaquin County, California |
1.67 |
|
Mitchell County, Georgia |
1.66 |
|
Lewis County, New York |
1.66 |
|
Henderson County, Tennessee |
1.65 |
|
Raleigh County, West Virginia |
1.64 |
|
Bedford County, Virginia |
1.63 |
|
Marion County, Mississippi |
1.62 |
|
Pickaway County, Ohio |
1.62 |
|
DeSoto County, Mississippi |
1.61 |
|
Rockingham County, North Carolina |
1.61 |
|
Rockingham County, Virginia |
1.61 |
|
Fond Du Lac County, Wisconsin |
1.61 |
|
Mitchell County, North Carolina |
1.6 |
|
Yakima County, Washington |
1.6 |
|
Reno County, Kansas |
1.59 |
|
Allegan County, Michigan |
1.59 |
|
Kent County, Michigan |
1.59 |
|
Titus County, Texas |
1.59 |
|
Walworth County, Wisconsin |
1.59 |
|
Sutter County, California |
1.57 |
|
Northampton County, Pennsylvania |
1.57 |
|
Washington County, Tennessee |
1.56 |
|
Jackson County, West Virginia |
1.56 |
|
Columbia County, New York |
1.55 |
|
Cleveland County, North Carolina |
1.55 |
|
Ellis County, Texas |
1.53 |
|
Clayton County, Iowa |
1.52 |
|
Tattnall County, Georgia |
1.51 |
|
Oceana County, Michigan |
1.51 |
|
Merrimack County, New Hampshire |
1.51 |
|
Chickasaw County, Mississippi |
1.48 |
|
Barry County, Missouri |
1.48 |
|
Winnebago County, Wisconsin |
1.48 |
|
Lawrence County, Missouri |
1.47 |
|
McDonald County, Missouri |
1.47 |
|
Lee County, Alabama |
1.46 |
|
Napa County, California |
1.45 |
|
Cumberland County, New Jersey |
1.44 |
|
Iosco County, Michigan |
1.43 |
|
Bryan County, Oklahoma |
1.43 |
|
Meade County, South Dakota |
1.43 |
|
Wayne County, West Virginia |
1.43 |
|
Anson County, North Carolina |
1.42 |
|
Campbell County, Tennessee |
1.42 |
|
Habersham County, Georgia |
1.41 |
|
Lincoln County, Oregon |
1.41 |
|
Kosciusko County, Indiana |
1.4 |
|
St. Francois County, Missouri |
1.4 |
|
Johnston County, North Carolina |
1.4 |
|
Glynn County, Georgia |
1.39 |
|
Fannin County, Georgia |
1.38 |
|
York County, Maine |
1.38 |
|
Montgomery County, Virginia |
1.37 |
|
Miami County, Ohio |
1.36 |
|
Carbon County, Pennsylvania |
1.36 |
|
Catawba County, North Carolina |
1.34 |
|
Wood County, Texas |
1.34 |
|
Levy County, Florida |
1.33 |
|
Nelson County, Kentucky |
1.33 |
|
Snohomish County, Washington |
1.33 |
|
Mayes County, Oklahoma |
1.32 |
|
Washington County, Oregon |
1.32 |
|
Lawrence County, Tennessee |
1.31 |
|
Washington County, Arkansas |
1.3 |
|
Bullitt County, Kentucky |
1.3 |
|
Phillips County, Arkansas |
1.29 |
|
Troup County, Georgia |
1.29 |
|
Guadalupe County, Texas |
1.29 |
|
Oneida County, New York |
1.28 |
|
Shenandoah County, Virginia |
1.27 |
|
Ada County, Idaho |
1.26 |
|
Douglas County, Wisconsin |
1.26 |
|
Indiana County, Pennsylvania |
1.25 |
|
Defiance County, Ohio |
1.24 |
|
Washington County, Rhode Island |
1.24 |
|
Wilson County, Tennessee |
1.24 |
|
Cherokee County, Georgia |
1.23 |
|
Butte County, California |
1.22 |
|
Riverside County, California |
1.22 |
|
Pittsburg County, Oklahoma |
1.22 |
|
Placer County, California |
1.21 |
|
Knox County, Indiana |
1.21 |
|
Adams County, Colorado |
1.19 |
|
Whiteside County, Illinois |
1.19 |
|
Navarro County, Texas |
1.19 |
|
Stanislaus County, California |
1.18 |
|
Walton County, Florida |
1.18 |
|
Marshall County, Kentucky |
1.18 |
|
Albemarle County, Virginia |
1.18 |
|
St. Joseph County, Indiana |
1.17 |
|
Lincoln County, South Dakota |
1.17 |
|
Apache County, Arizona |
1.16 |
|
Sebastian County, Arkansas |
1.16 |
|
LaPorte County, Indiana |
1.16 |
|
Washington County, Utah |
1.15 |
|
Clark County, Washington |
1.15 |
|
Hall County, Georgia |
1.14 |
|
Woodford County, Illinois |
1.14 |
|
Harvey County, Kansas |
1.14 |
|
Washington County, Pennsylvania |
1.13 |
|
Sonoma County, California |
1.12 |
|
Brown County, Wisconsin |
1.12 |
|
Horry County, South Carolina |
1.1 |
|
Crawford County, Arkansas |
1.09 |
|
Lee County, Mississippi |
1.09 |
|
Yadkin County, North Carolina |
1.09 |
|
Waushara County, Wisconsin |
1.09 |
|
Bristol County, Massachusetts |
1.08 |
|
Rock County, Wisconsin |
1.08 |
|
Mobile County, Alabama |
1.07 |
|
Warren County, Kentucky |
1.07 |
|
Rensselaer County, New York |
1.07 |
|
Lawrence County, Pennsylvania |
1.07 |
|
Morrison County, Minnesota |
1.06 |
|
Shelby County, Alabama |
1.05 |
|
Newton County, Georgia |
1.04 |
|
Bonneville County, Idaho |
1.04 |
|
Union County, Ohio |
1.04 |
|
Tulare County, California |
1.03 |
|
Bibb County, Georgia |
1.03 |
|
Cambria County, Pennsylvania |
1.03 |
|
Cherokee County, Alabama |
1.02 |
|
Putnam County, Florida |
1.02 |
|
Twin Falls County, Idaho |
1.02 |
|
Oswego County, New York |
1.02 |
|
Wayne County, New York |
1.02 |
|
Weld County, Colorado |
1 |
|
Forsyth County, Georgia |
1 |
|
Power County, Idaho |
1 |
|
Westmoreland County, Pennsylvania |
1 |
|
Wexford County, Michigan |
0.99 |
|
York County, Pennsylvania |
0.99 |
|
San Bernardino County, California |
0.98 |
|
Tazewell County, Illinois |
0.98 |
|
Ouachita Parish, Louisiana |
0.98 |
|
Lowndes County, Mississippi |
0.98 |
|
Yolo County, California |
0.97 |
|
Nicollet County, Minnesota |
0.97 |
|
Scioto County, Ohio |
0.97 |
|
Kennebec County, Maine |
0.96 |
|
Kaufman County, Texas |
0.96 |
|
Lamoille County, Vermont |
0.96 |
|
Clinton County, Iowa |
0.95 |
|
Pearl River County, Mississippi |
0.95 |
|
Gaston County, North Carolina |
0.95 |
|
Bingham County, Idaho |
0.94 |
|
Hampshire County, Massachusetts |
0.94 |
|
Guernsey County, Ohio |
0.94 |
|
Charlotte County, Florida |
0.93 |
|
Jackson County, Iowa |
0.93 |
|
Calcasieu Parish, Louisiana |
0.93 |
|
Bay County, Michigan |
0.93 |
|
Yuma County, Arizona |
0.92 |
|
Decatur County, Indiana |
0.92 |
|
San Juan County, Washington |
0.92 |
|
Elmore County, Alabama |
0.91 |
|
Oktibbeha County, Mississippi |
0.91 |
|
Greene County, Missouri |
0.91 |
|
Sullivan County, Tennessee |
0.9 |
|
Allen County, Ohio |
0.89 |
|
St. Croix County, Wisconsin |
0.89 |
|
Richmond County, Georgia |
0.88 |
|
Marion County, Illinois |
0.88 |
|
Daviess County, Kentucky |
0.88 |
|
Butler County, Pennsylvania |
0.88 |
|
Spartanburg County, South Carolina |
0.88 |
|
Robertson County, Tennessee |
0.88 |
|
White County, Arkansas |
0.87 |
|
Manatee County, Florida |
0.87 |
|
Effingham County, Illinois |
0.87 |
|
Miami County, Indiana |
0.87 |
|
Polk County, Iowa |
0.87 |
|
Craven County, North Carolina |
0.87 |
|
McMinn County, Tennessee |
0.87 |
|
Alachua County, Florida |
0.86 |
|
Clermont County, Ohio |
0.85 |
|
Oconee County, South Carolina |
0.85 |
|
Kittitas County, Washington |
0.84 |
|
Osceola County, Florida |
0.83 |
|
Livingston County, New York |
0.83 |
|
Stark County, Ohio |
0.83 |
|
Litchfield County, Connecticut |
0.81 |
|
Washington County, Wisconsin |
0.81 |
|
Sussex County, Delaware |
0.8 |
|
Sangamon County, Illinois |
0.8 |
|
Shelby County, Indiana |
0.8 |
|
Unknown Or Undefined, Louisiana |
0.8 |
|
Franklin County, Massachusetts |
0.8 |
|
Fauquier County, Virginia |
0.8 |
|
DeSoto County, Florida |
0.79 |
|
DeKalb County, Illinois |
0.79 |
|
Muscatine County, Iowa |
0.79 |
|
Cole County, Missouri |
0.79 |
|
Madison County, Ohio |
0.79 |
|
Tarrant County, Texas |
0.79 |
|
Vernon County, Missouri |
0.78 |
|
Utah County, Utah |
0.78 |
|
St. Lawrence County, New York |
0.77 |
|
Putnam County, Tennessee |
0.77 |
|
Grayson County, Texas |
0.77 |
|
Stearns County, Minnesota |
0.76 |
|
Chautauqua County, New York |
0.76 |
|
Cumberland County, North Carolina |
0.76 |
|
Bradley County, Tennessee |
0.76 |
|
Baxter County, Arkansas |
0.75 |
|
Fresno County, California |
0.75 |
|
Blaine County, Idaho |
0.74 |
|
Bell County, Kentucky |
0.74 |
|
Rankin County, Mississippi |
0.74 |
|
Franklin County, Missouri |
0.74 |
|
Erie County, New York |
0.74 |
|
Brunswick County, North Carolina |
0.74 |
|
Iredell County, North Carolina |
0.74 |
|
Berks County, Pennsylvania |
0.74 |
|
Anderson County, South Carolina |
0.74 |
|
Washington County, Vermont |
0.74 |
|
Dougherty County, Georgia |
0.73 |
|
St. Louis County, Minnesota |
0.73 |
|
Audrain County, Missouri |
0.73 |
|
Gallatin County, Montana |
0.73 |
|
Ontario County, New York |
0.73 |
|
Guilford County, North Carolina |
0.73 |
|
Chesapeake City, Virginia |
0.73 |
|
Duval County, Florida |
0.72 |
|
Christian County, Kentucky |
0.72 |
|
Tangipahoa Parish, Louisiana |
0.72 |
|
Cumberland County, Maine |
0.72 |
|
Blount County, Tennessee |
0.72 |
|
Santa Rosa County, Florida |
0.71 |
|
Cecil County, Maryland |
0.71 |
|
Maury County, Tennessee |
0.71 |
|
New Hanover County, North Carolina |
0.7 |
|
Garfield County, Colorado |
0.69 |
|
Anoka County, Minnesota |
0.69 |
|
DeKalb County, Georgia |
0.68 |
|
Wood County, Ohio |
0.68 |
|
Erie County, Pennsylvania |
0.68 |
|
Trumbull County, Ohio |
0.67 |
|
Wasatch County, Utah |
0.67 |
|
Montgomery County, Alabama |
0.66 |
|
Franklin County, Arkansas |
0.66 |
|
Union County, New Jersey |
0.66 |
|
Sacramento County, California |
0.65 |
|
Schenectady County, New York |
0.65 |
|
Maricopa County, Arizona |
0.64 |
|
Frederick County, Maryland |
0.64 |
|
Saratoga County, New York |
0.64 |
|
Lee County, North Carolina |
0.64 |
|
Seminole County, Florida |
0.63 |
|
Kane County, Illinois |
0.63 |
|
Chester County, Pennsylvania |
0.63 |
|
Weber County, Utah |
0.63 |
|
Jefferson County, Wisconsin |
0.63 |
|
Natrona County, Wyoming |
0.63 |
|
Jefferson County, Kentucky |
0.62 |
|
Chisago County, Minnesota |
0.62 |
|
Hancock County, Ohio |
0.62 |
|
Dorchester County, South Carolina |
0.62 |
|
Rutherford County, Tennessee |
0.62 |
|
St. Landry Parish, Louisiana |
0.61 |
|
Knox County, Maine |
0.61 |
|
Watauga County, North Carolina |
0.61 |
|
Jasper County, Missouri |
0.6 |
|
Franklin County, New York |
0.6 |
|
Boulder County, Colorado |
0.59 |
|
Martin County, Florida |
0.59 |
|
Lubbock County, Texas |
0.59 |
|
Salt Lake County, Utah |
0.59 |
|
Fairbanks North Star Borough, Alaska |
0.58 |
|
Berrien County, Michigan |
0.58 |
|
Dakota County, Minnesota |
0.58 |
|
Madison County, North Carolina |
0.58 |
|
Bell County, Texas |
0.58 |
|
Cache County, Utah |
0.58 |
|
Nantucket County, Massachusetts |
0.57 |
|
Worcester County, Massachusetts |
0.57 |
|
Unknown Or Undefined, Arkansas |
0.56 |
|
Larimer County, Colorado |
0.56 |
|
Gwinnett County, Georgia |
0.56 |
|
Bernalillo County, New Mexico |
0.56 |
|
Ashland County, Ohio |
0.56 |
|
Cleburne County, Arkansas |
0.55 |
|
Carroll County, Georgia |
0.55 |
|
Cobb County, Georgia |
0.55 |
|
Muscogee County, Georgia |
0.55 |
|
Cumberland County, Pennsylvania |
0.55 |
|
Madison County, Illinois |
0.54 |
|
Lexington County, South Carolina |
0.54 |
|
Coffee County, Tennessee |
0.54 |
|
Bexar County, Texas |
0.54 |
|
Jefferson County, New York |
0.53 |
|
Minnehaha County, South Dakota |
0.53 |
|
Berkshire County, Massachusetts |
0.52 |
|
Broome County, New York |
0.52 |
|
Orange County, New York |
0.52 |
|
Davis County, Utah |
0.52 |
|
Pinellas County, Florida |
0.51 |
|
LaSalle County, Illinois |
0.51 |
|
Payne County, Oklahoma |
0.51 |
|
Henrico County, Virginia |
0.51 |
|
Wythe County, Virginia |
0.51 |
|
Spokane County, Washington |
0.51 |
|
Jackson County, Mississippi |
0.5 |
|
Washoe County, Nevada |
0.5 |
|
Niagara County, New York |
0.5 |
|
Cabarrus County, North Carolina |
0.5 |
|
Butler County, Ohio |
0.5 |
|
Fulton County, Ohio |
0.5 |
|
Tolland County, Connecticut |
0.49 |
|
Yellowstone County, Montana |
0.49 |
|
Rockingham County, New Hampshire |
0.49 |
|
Forsyth County, North Carolina |
0.49 |
|
Medina County, Ohio |
0.49 |
|
Richland County, Ohio |
0.49 |
|
Bucks County, Pennsylvania |
0.49 |
|
Floyd County, Virginia |
0.49 |
|
Carolina Municipio, Puerto Rico |
0.49 |
|
Santa Cruz County, California |
0.48 |
|
Hampden County, Massachusetts |
0.48 |
|
Lewis and Clark County, Montana |
0.48 |
|
Steuben County, New York |
0.48 |
|
Coconino County, Arizona |
0.47 |
|
Hillsborough County, Florida |
0.47 |
|
Gloucester County, New Jersey |
0.47 |
|
Columbia County, Pennsylvania |
0.47 |
|
Roane County, Tennessee |
0.47 |
|
Dallas County, Texas |
0.47 |
|
Milwaukee County, Wisconsin |
0.47 |
|
Denver County, Colorado |
0.46 |
|
Caddo Parish, Louisiana |
0.46 |
|
Webster Parish, Louisiana |
0.46 |
|
Hinds County, Mississippi |
0.46 |
|
Wyandotte County, Kansas |
0.45 |
|
Scott County, Minnesota |
0.45 |
|
Knox County, Tennessee |
0.45 |
|
Unicoi County, Tennessee |
0.45 |
|
Smith County, Texas |
0.45 |
|
Stafford County, Virginia |
0.45 |
|
Mesa County, Colorado |
0.44 |
|
Chatham County, Georgia |
0.44 |
|
Fulton County, Georgia |
0.44 |
|
Ingham County, Michigan |
0.44 |
|
Luzerne County, Pennsylvania |
0.44 |
|
Solano County, California |
0.43 |
|
Bay County, Florida |
0.43 |
|
Marion County, Indiana |
0.42 |
|
Delaware County, Oklahoma |
0.42 |
|
El Paso County, Texas |
0.42 |
|
Summit County, Utah |
0.42 |
|
Palm Beach County, Florida |
0.41 |
|
Santa Cruz County, Arizona |
0.4 |
|
Lake County, Indiana |
0.4 |
|
Unknown Or Undefined, Michigan |
0.4 |
|
Onondaga County, New York |
0.4 |
|
Shelby County, Tennessee |
0.4 |
|
Thurston County, Washington |
0.4 |
|
Lee County, Florida |
0.39 |
|
Hunterdon County, New Jersey |
0.39 |
|
Wake County, North Carolina |
0.39 |
|
Polk County, Oregon |
0.39 |
|
Dauphin County, Pennsylvania |
0.39 |
|
Pulaski County, Arkansas |
0.38 |
|
Mecklenburg County, North Carolina |
0.38 |
|
Huron County, Ohio |
0.38 |
|
Pueblo County, Colorado |
0.37 |
|
Lake County, Florida |
0.37 |
|
Huron County, Michigan |
0.37 |
|
Burlington County, New Jersey |
0.37 |
|
Loudoun County, Virginia |
0.37 |
|
Polk County, Georgia |
0.36 |
|
Cape Girardeau County, Missouri |
0.36 |
|
Buncombe County, North Carolina |
0.36 |
|
Portage County, Ohio |
0.36 |
|
Bedford County, Tennessee |
0.36 |
|
Davidson County, Tennessee |
0.36 |
|
Harris County, Texas |
0.36 |
|
Camden County, New Jersey |
0.35 |
|
Cayuga County, New York |
0.35 |
|
Kings County, New York |
0.35 |
|
Unknown Or Undefined, North Carolina |
0.35 |
|
Dane County, Wisconsin |
0.35 |
|
Johnson County, Wyoming |
0.35 |
|
Madison County, Alabama |
0.34 |
|
Unknown Or Undefined, Alabama |
0.34 |
|
Orange County, California |
0.34 |
|
Black Hawk County, Iowa |
0.34 |
|
Unknown Or Undefined, Kentucky |
0.34 |
|
Unknown Or Undefined, Maryland |
0.34 |
|
Ramsey County, Minnesota |
0.34 |
|
Platte County, Nebraska |
0.34 |
|
Unknown Or Undefined, New Jersey |
0.34 |
|
Montgomery County, Texas |
0.34 |
|
Franklin County, Vermont |
0.34 |
|
Sedgwick County, Kansas |
0.33 |
|
St. Tammany Parish, Louisiana |
0.33 |
|
Wicomico County, Maryland |
0.33 |
|
Robeson County, North Carolina |
0.33 |
|
Multnomah County, Oregon |
0.33 |
|
Greenville County, South Carolina |
0.33 |
|
Richland County, South Carolina |
0.33 |
|
Kerr County, Texas |
0.33 |
|
Talladega County, Alabama |
0.32 |
|
Pima County, Arizona |
0.32 |
|
Howard County, Indiana |
0.32 |
|
Carver County, Minnesota |
0.32 |
|
St. Louis City, Missouri |
0.32 |
|
Suffolk County, New York |
0.32 |
|
Centre County, Pennsylvania |
0.32 |
|
Beaufort County, South Carolina |
0.32 |
|
New Haven County, Connecticut |
0.31 |
|
Winnebago County, Illinois |
0.31 |
|
Washington County, Virginia |
0.31 |
|
Contra Costa County, California |
0.3 |
|
El Paso County, Colorado |
0.3 |
|
Grundy County, Illinois |
0.3 |
|
Jackson County, Missouri |
0.3 |
|
Cascade County, Montana |
0.3 |
|
Silver Bow County, Montana |
0.3 |
|
Hillsborough County, New Hampshire |
0.3 |
|
Dutchess County, New York |
0.3 |
|
Sullivan County, New York |
0.3 |
|
Burleigh County, North Dakota |
0.3 |
|
Alameda County, California |
0.29 |
|
McHenry County, Illinois |
0.29 |
|
Vanderburgh County, Indiana |
0.29 |
|
Cheboygan County, Michigan |
0.29 |
|
Macomb County, Michigan |
0.29 |
|
Butler County, Missouri |
0.29 |
|
Delaware County, Pennsylvania |
0.29 |
|
Galveston County, Texas |
0.29 |
|
Washington County, Maryland |
0.28 |
|
Cuyahoga County, Ohio |
0.28 |
|
Hamilton County, Ohio |
0.28 |
|
Providence County, Rhode Island |
0.28 |
|
Faulkner County, Arkansas |
0.27 |
|
Whitfield County, Georgia |
0.27 |
|
Monroe County, Indiana |
0.27 |
|
Charles County, Maryland |
0.27 |
|
Mecosta County, Michigan |
0.27 |
|
Oklahoma County, Oklahoma |
0.27 |
|
Sevier County, Tennessee |
0.27 |
|
Denton County, Texas |
0.27 |
|
Richmond City, Virginia |
0.27 |
|
Los Angeles County, California |
0.26 |
|
Unknown Or Undefined, California |
0.26 |
|
Hardin County, Kentucky |
0.26 |
|
Saginaw County, Michigan |
0.26 |
|
Passaic County, New Jersey |
0.26 |
|
Ulster County, New York |
0.26 |
|
Henderson County, North Carolina |
0.26 |
|
Lucas County, Ohio |
0.26 |
|
Travis County, Texas |
0.26 |
|
Santa Clara County, California |
0.25 |
|
Miami-Dade County, Florida |
0.25 |
|
Chaves County, New Mexico |
0.25 |
|
Beaver County, Pennsylvania |
0.25 |
|
Chittenden County, Vermont |
0.25 |
|
Ventura County, California |
0.24 |
|
Volusia County, Florida |
0.24 |
|
Allen County, Indiana |
0.24 |
|
Baltimore City, Maryland |
0.24 |
|
Genesee County, Michigan |
0.24 |
|
Grand Traverse County, Michigan |
0.24 |
|
Monroe County, Pennsylvania |
0.24 |
|
Prince George County, Virginia |
0.24 |
|
Grant County, Washington |
0.24 |
|
Wood County, West Virginia |
0.24 |
|
Broward County, Florida |
0.23 |
|
Adams County, Illinois |
0.23 |
|
Albany County, New York |
0.23 |
|
Newport County, Rhode Island |
0.23 |
|
Brazos County, Texas |
0.23 |
|
King County, Washington |
0.23 |
|
Collier County, Florida |
0.22 |
|
Hennepin County, Minnesota |
0.22 |
|
Atlantic County, New Jersey |
0.22 |
|
Collin County, Texas |
0.22 |
|
Williamson County, Texas |
0.22 |
|
Lake County, California |
0.21 |
|
Will County, Illinois |
0.21 |
|
East Baton Rouge Parish, Louisiana |
0.21 |
|
Barnstable County, Massachusetts |
0.21 |
|
Norfolk County, Massachusetts |
0.21 |
|
Montgomery County, Ohio |
0.21 |
|
Warren County, Ohio |
0.21 |
|
Montgomery County, Pennsylvania |
0.21 |
|
Gregg County, Texas |
0.21 |
|
Prince William County, Virginia |
0.21 |
|
Etowah County, Alabama |
0.2 |
|
Hartford County, Connecticut |
0.2 |
|
New Castle County, Delaware |
0.2 |
|
Santa Fe County, New Mexico |
0.2 |
|
La Plata County, Colorado |
0.19 |
|
Fairfield County, Connecticut |
0.19 |
|
Rock Island County, Illinois |
0.19 |
|
Johnson County, Kansas |
0.19 |
|
Boone County, Kentucky |
0.19 |
|
Plymouth County, Massachusetts |
0.19 |
|
Middlesex County, New Jersey |
0.19 |
|
Clinton County, New York |
0.19 |
|
Lorain County, Ohio |
0.19 |
|
Summit County, Ohio |
0.19 |
|
Monongalia County, West Virginia |
0.19 |
|
Arapahoe County, Colorado |
0.18 |
|
Brevard County, Florida |
0.18 |
|
Sarasota County, Florida |
0.18 |
|
Clay County, Missouri |
0.18 |
|
Taney County, Missouri |
0.18 |
|
Sandusky County, Ohio |
0.18 |
|
Unknown Or Undefined, South Carolina |
0.18 |
|
Waukesha County, Wisconsin |
0.18 |
|
Jefferson County, Alabama |
0.17 |
|
Hernando County, Florida |
0.17 |
|
Orange County, Florida |
0.17 |
|
Cook County, Illinois |
0.17 |
|
Riley County, Kansas |
0.17 |
|
Essex County, Massachusetts |
0.17 |
|
Madison County, Mississippi |
0.17 |
|
Lancaster County, Nebraska |
0.17 |
|
Potter County, Texas |
0.17 |
|
Harrison County, West Virginia |
0.17 |
|
Washtenaw County, Michigan |
0.16 |
|
Clark County, Nevada |
0.16 |
|
Bronx County, New York |
0.16 |
|
Allegheny County, Pennsylvania |
0.16 |
|
Hamilton County, Tennessee |
0.16 |
|
Brazoria County, Texas |
0.16 |
|
Nueces County, Texas |
0.16 |
|
Unknown Or Undefined, West Virginia |
0.16 |
|
DuPage County, Illinois |
0.15 |
|
Douglas County, Nebraska |
0.15 |
|
Ocean County, New Jersey |
0.15 |
|
Hidalgo County, Texas |
0.15 |
|
Suffolk City, Virginia |
0.15 |
|
Kitsap County, Washington |
0.15 |
|
Anchorage Borough, Alaska |
0.14 |
|
Cochise County, Arizona |
0.14 |
|
Douglas County, Colorado |
0.14 |
|
Escambia County, Florida |
0.14 |
|
Lake County, Illinois |
0.14 |
|
Fayette County, Kentucky |
0.14 |
|
Sherburne County, Minnesota |
0.14 |
|
Charleston County, South Carolina |
0.14 |
|
Midland County, Texas |
0.14 |
|
Yavapai County, Arizona |
0.13 |
|
Benton County, Arkansas |
0.13 |
|
San Diego County, California |
0.13 |
|
Santa Barbara County, California |
0.13 |
|
Unknown Or Undefined, Florida |
0.13 |
|
Unknown Or Undefined, Idaho |
0.13 |
|
Unknown Or Undefined, Illinois |
0.13 |
|
Shawnee County, Kansas |
0.13 |
|
Bergen County, New Jersey |
0.13 |
|
Franklin County, Ohio |
0.13 |
|
Tulsa County, Oklahoma |
0.13 |
|
Unknown Or Undefined, Virginia |
0.13 |
|
Kern County, California |
0.12 |
|
Eagle County, Colorado |
0.12 |
|
Pasco County, Florida |
0.12 |
|
Unknown Or Undefined, Indiana |
0.12 |
|
Scott County, Iowa |
0.12 |
|
Jefferson Parish, Louisiana |
0.12 |
|
Prince George's County, Maryland |
0.12 |
|
Essex County, New Jersey |
0.12 |
|
Nassau County, New York |
0.12 |
|
Fort Bend County, Texas |
0.12 |
|
San Juan Municipio, Puerto Rico |
0.12 |
|
Hawaii County, Hawaii |
0.11 |
|
Wayne County, Michigan |
0.11 |
|
St. Louis County, Missouri |
0.11 |
|
Cameron County, Texas |
0.11 |
|
Terrebonne Parish, Louisiana |
0.1 |
|
Baltimore County, Maryland |
0.1 |
|
Calhoun County, Michigan |
0.1 |
|
Kalamazoo County, Michigan |
0.1 |
|
Cleveland County, Oklahoma |
0.1 |
|
Monterey County, California |
0.09 |
|
Unknown Or Undefined, Georgia |
0.09 |
|
Honolulu County, Hawaii |
0.09 |
|
Anne Arundel County, Maryland |
0.09 |
|
Somerset County, New Jersey |
0.09 |
|
Monroe County, New York |
0.09 |
|
Kenosha County, Wisconsin |
0.09 |
|
Middlesex County, Massachusetts |
0.08 |
|
Valencia County, New Mexico |
0.08 |
|
Queens County, New York |
0.08 |
|
Rockland County, New York |
0.08 |
|
Philadelphia County, Pennsylvania |
0.08 |
|
Berkeley County, South Carolina |
0.08 |
|
Clay County, Florida |
0.07 |
|
Howard County, Maryland |
0.07 |
|
Oakland County, Michigan |
0.07 |
|
Jefferson County, Missouri |
0.07 |
|
St. Charles County, Missouri |
0.07 |
|
Monmouth County, New Jersey |
0.07 |
|
Putnam County, New York |
0.07 |
|
San Francisco County, California |
0.06 |
|
San Mateo County, California |
0.06 |
|
Suffolk County, Massachusetts |
0.06 |
|
Boone County, Missouri |
0.06 |
|
Unknown Or Undefined, Oklahoma |
0.06 |
|
San Luis Obispo County, California |
0.05 |
|
Jefferson County, Colorado |
0.05 |
|
Leon County, Florida |
0.05 |
|
Clarke County, Georgia |
0.05 |
|
Hamilton County, Indiana |
0.05 |
|
Orleans Parish, Louisiana |
0.05 |
|
Ross County, Ohio |
0.05 |
|
Kanawha County, West Virginia |
0.05 |
|
Clayton County, Georgia |
0.04 |
|
Unknown Or Undefined, Minnesota |
0.04 |
|
Hudson County, New Jersey |
0.04 |
|
Comal County, Texas |
0.04 |
|
St. Clair County, Michigan |
0.03 |
|
Unknown Or Undefined, New York |
0.03 |
|
Unknown Or Undefined, Texas |
0.03 |
|
Fairfax County, Virginia |
0.03 |
|
Virginia Beach City, Virginia |
0.03 |
|
Marin County, California |
0.02 |
|
Morris County, New Jersey |
0.02 |
|
Source: U.S. Bureau of Labor Statistics, Quarterly Census of Employment and Wages. |
|
| Occupation | Percent of occupation in wood product manufacturing | Total employment | Employment in wood product manufacturing |
|---|---|---|---|
| Sawing machine setters, operators, and tenders, wood | 77.1 | 48,600 | 37,470 |
| Log graders and scalers | 75.2 | 2,740 | 2,060 |
| Woodworking machine setters, operators, and tenders, except sawing | 64.5 | 75,540 | 48,760 |
| Woodworkers, all other | 42.8 | 6,900 | 2,950 |
| Source: U.S. Bureau of Labor Statistics, Occupational Employment Statistics. | |||
| Area | Location quotient |
|---|---|
|
Southwest Alabama nonmetropolitan area |
29.39 |
|
Northwestern Wisconsin nonmetropolitan area |
24.59 |
|
Panhandle of Idaho nonmetropolitan area |
23.66 |
|
Southwest Washington nonmetropolitan area |
17.58 |
|
Big Thicket Region of Texas nonmetropolitan area |
17.56 |
|
Northwest Virginia nonmetropolitan area |
15.58 |
|
Longview, Washington |
15.19 |
|
East Georgia nonmetropolitan area |
14.71 |
|
Grants Pass, Oregon |
14.17 |
|
South Coast Oregon nonmetropolitan area |
13.66 |
| Source: U.S. Bureau of Labor Statistics, Occupational Employment Survey. | |
Note: The North American Industry Classification System groups this industry under “fabric mills.”
| County | Location quotient |
|---|---|
|
Piscataquis County, Maine |
119.26 |
|
Chesterfield County, South Carolina |
102.64 |
|
Anderson County, South Carolina |
64.98 |
|
Grayson County, Virginia |
52.91 |
|
Rockingham County, North Carolina |
48.57 |
|
Pickens County, South Carolina |
37.73 |
|
Alamance County, North Carolina |
31.25 |
|
Henderson County, North Carolina |
29.28 |
|
Strafford County, New Hampshire |
28.7 |
|
Spartanburg County, South Carolina |
26.84 |
| Source: U.S. Bureau of Labor Statistics, Quarterly Census of Employment and Wages. | |

| County | Location quotient |
|---|---|
|
Piscataquis County, Maine |
119.26 |
|
Chesterfield County, South Carolina |
102.64 |
|
Anderson County, South Carolina |
64.98 |
|
Grayson County, Virginia |
52.91 |
|
Rockingham County, North Carolina |
48.57 |
|
Pickens County, South Carolina |
37.73 |
|
Alamance County, North Carolina |
31.25 |
|
Henderson County, North Carolina |
29.28 |
|
Strafford County, New Hampshire |
28.7 |
|
Spartanburg County, South Carolina |
26.84 |
|
Lincoln County, North Carolina |
26.28 |
|
Edgecombe County, North Carolina |
25.87 |
|
Iredell County, North Carolina |
24.34 |
|
Cleveland County, North Carolina |
23.59 |
|
Rutherford County, North Carolina |
17.41 |
|
Gaston County, North Carolina |
15.26 |
|
Catawba County, North Carolina |
13.34 |
|
Caldwell County, North Carolina |
12.35 |
|
Outagamie County, Wisconsin |
11.18 |
|
Kennebec County, Maine |
10.99 |
|
Greenville County, South Carolina |
10.08 |
|
Providence County, Rhode Island |
9.59 |
|
Guilford County, North Carolina |
8.46 |
|
York County, South Carolina |
6.31 |
|
Lexington County, South Carolina |
6.04 |
|
Forsyth County, North Carolina |
4.44 |
|
Mecklenburg County, North Carolina |
2.12 |
|
Kent County, Rhode Island |
1.11 |
|
Lake County, Illinois |
0.98 |
|
Erie County, New York |
0.93 |
|
Los Angeles County, California |
0.77 |
|
Knox County, Tennessee |
0.57 |
|
Passaic County, New Jersey |
0.53 |
|
Allegheny County, Pennsylvania |
0.52 |
|
Palm Beach County, Florida |
0.48 |
|
Philadelphia County, Pennsylvania |
0.47 |
|
Fulton County, Georgia |
0.4 |
|
Queens County, New York |
0.29 |
|
Miami-Dade County, Florida |
0.27 |
|
Hudson County, New Jersey |
0.26 |
|
Middlesex County, Massachusetts |
0.25 |
|
Kings County, New York |
0.24 |
|
Unknown Or Undefined, Michigan |
0.23 |
|
Unknown Or Undefined, South Carolina |
0.15 |
|
Cook County, Illinois |
0.13 |
|
Morris County, New Jersey |
0.13 |
|
Monmouth County, New Jersey |
0.12 |
|
Unknown Or Undefined, California |
0.05 |
|
Wayne County, Michigan |
0.05 |
|
King County, Washington |
0.05 |
|
Cuyahoga County, Ohio |
0.01 |
|
Source: U.S. Bureau of Labor Statistics, Quarterly Census of Employment and Wages. |
|
| Occupation | Percent of occupation in fabric mills | Total employment | Employment in fabric mills |
|---|---|---|---|
| Textile knitting and weaving machine setters, operators, and tenders | 60.2 | 22,560 | 13,570 |
| Textile winding, twisting, and drawing out machine setters, operators, and tenders | 19.8 | 27,760 | 5,490 |
| Fabric menders, except garment | 17.7 | 620 | 110 |
| Source: U.S. Bureau of Labor Statistics, Occupational Employment Statistics. | |||
| Area | Location quotient |
|---|---|
|
Dalton, Georgia |
165.63 |
|
Burlington, North Carolina |
71.22 |
|
North Georgia nonmetropolitan area |
45.80 |
|
Northeast Alabama nonmetropolitan area |
28.15 |
|
Bloomsburg-Berwick, Pennsylvania |
28.06 |
|
Middle Georgia nonmetropolitan area |
27.25 |
|
Piedmont North Carolina nonmetropolitan area |
27.17 |
|
Spartanburg, South Carolina |
24.49 |
|
Upper Savannah South Carolina nonmetropolitan area |
23.42 |
|
Greenville-Anderson-Mauldin, South Carolina |
22.63 |
| Source: U.S. Bureau of Labor Statistics, Occupational Employment Statistics. | |
Note: The North American Industry Classification System groups this industry under “oilseed and grain farming.” The OES survey excludes most of the agricultural sector, with the exception of logging, support activities for crop production, and support activities for animal production. The OES survey does not include the oilseed and grain farming industry; therefore, occupation location quotients cannot be calculated.
| County | Location quotient |
|---|---|
|
Sully County, South Dakota |
363.58 |
|
Columbia County, Washington |
214.56 |
|
Sharkey County, Mississippi |
200.61 |
|
Gosper County, Nebraska |
194.71 |
|
Hickman County, Kentucky |
185.8 |
|
Lincoln County, Washington |
173.86 |
|
Warren County, Indiana |
173.59 |
|
Mississippi County, Missouri |
165.25 |
|
Stanton County, Kansas |
161.98 |
|
Tipton County, Indiana |
148.74 |
| Source: U.S. Bureau of Labor Statistics, Quarterly Census of Employment and Wages. | |

| County | Location quotient |
|---|---|
|
Sully County, South Dakota |
363.58 |
|
Columbia County, Washington |
214.56 |
|
Sharkey County, Mississippi |
200.61 |
|
Gosper County, Nebraska |
194.71 |
|
Hickman County, Kentucky |
185.8 |
|
Lincoln County, Washington |
173.86 |
|
Warren County, Indiana |
173.59 |
|
Mississippi County, Missouri |
165.25 |
|
Stanton County, Kansas |
161.98 |
|
Tipton County, Indiana |
148.74 |
|
East Carroll Parish, Louisiana |
141.6 |
|
Tyrrell County, North Carolina |
136.4 |
|
Lee County, Arkansas |
135.21 |
|
Carlisle County, Kentucky |
134.87 |
|
Hand County, South Dakota |
133.31 |
|
Clay County, Arkansas |
132.45 |
|
Dickey County, North Dakota |
131.91 |
|
Franklin County, Nebraska |
127.46 |
|
Sherman County, Texas |
127.05 |
|
Colusa County, California |
126.84 |
|
Perkins County, Nebraska |
124.9 |
|
Quitman County, Mississippi |
122.46 |
|
Traill County, North Dakota |
115.82 |
|
LaMoure County, North Dakota |
114.26 |
|
Traverse County, Minnesota |
113.95 |
|
Norman County, Minnesota |
111.62 |
|
Wilkin County, Minnesota |
108.24 |
|
Liberty County, Montana |
107.63 |
|
Pratt County, Kansas |
107 |
|
Woodruff County, Arkansas |
106.24 |
|
Poinsett County, Arkansas |
104.14 |
|
Steele County, North Dakota |
101.05 |
|
Stevens County, Kansas |
100.98 |
|
Adams County, North Dakota |
98.56 |
|
Kiowa County, Kansas |
98.4 |
|
Humphreys County, Mississippi |
97.74 |
|
Morrill County, Nebraska |
97.46 |
|
Kearny County, Kansas |
97.17 |
|
Parmer County, Texas |
93.94 |
|
Chicot County, Arkansas |
92.9 |
|
Deuel County, Nebraska |
92.46 |
|
Grant County, Minnesota |
90.71 |
|
Chouteau County, Montana |
88.75 |
|
Tallahatchie County, Mississippi |
88.74 |
|
Monroe County, Arkansas |
88.53 |
|
DeWitt County, Illinois |
88.07 |
|
Kiowa County, Colorado |
86.87 |
|
Edmunds County, South Dakota |
86.55 |
|
Spink County, South Dakota |
85.81 |
|
Phillips County, Arkansas |
84.5 |
|
Prairie County, Arkansas |
82.66 |
|
Pembina County, North Dakota |
82.57 |
|
Desha County, Arkansas |
82.5 |
|
Greeley County, Kansas |
81.71 |
|
Nelson County, North Dakota |
81.71 |
|
Hartley County, Texas |
79.11 |
|
Stafford County, Kansas |
76.41 |
|
Mason County, Illinois |
76.27 |
|
Cheyenne County, Kansas |
71.58 |
|
Dundy County, Nebraska |
71.06 |
|
Kit Carson County, Colorado |
69.71 |
|
Dallam County, Texas |
69.13 |
|
Carroll County, Missouri |
69.12 |
|
Holt County, Missouri |
69.05 |
|
Stoddard County, Missouri |
69.02 |
|
Custer County, Nebraska |
68.68 |
|
Jackson County, Arkansas |
67.82 |
|
McHenry County, North Dakota |
66.8 |
|
Lawrence County, Arkansas |
66.48 |
|
Washington County, Kansas |
66.35 |
|
Boyd County, Nebraska |
65.71 |
|
Gray County, Kansas |
65.3 |
|
Lake County, Tennessee |
65.29 |
|
Bolivar County, Mississippi |
65.1 |
|
Antelope County, Nebraska |
64.97 |
|
Kidder County, North Dakota |
64.16 |
|
Walsh County, North Dakota |
64 |
|
Wheeler County, Nebraska |
63.67 |
|
Rock County, Nebraska |
63.63 |
|
Lawrence County, Illinois |
63.48 |
|
Hyde County, North Carolina |
62.88 |
|
Hansford County, Texas |
62.81 |
|
Sargent County, North Dakota |
61.94 |
|
Camden County, North Carolina |
61.92 |
|
Grundy County, Iowa |
61.72 |
|
Fillmore County, Nebraska |
61.32 |
|
Osceola County, Iowa |
61.31 |
|
Iowa County, Iowa |
61 |
|
Kingsbury County, South Dakota |
60.8 |
|
Phillips County, Colorado |
59.88 |
|
Richland County, North Dakota |
59.82 |
|
Box Butte County, Nebraska |
59.61 |
|
Renville County, Minnesota |
59.25 |
|
Tunica County, Mississippi |
57.38 |
|
Hamilton County, Nebraska |
57.26 |
|
Sunflower County, Mississippi |
54.75 |
|
Stanley County, South Dakota |
54.32 |
|
Holt County, Nebraska |
54.26 |
|
Clark County, South Dakota |
54.05 |
|
Lincoln County, Arkansas |
53.65 |
|
Scott County, Kansas |
53.46 |
|
Haakon County, South Dakota |
53.18 |
|
Yuma County, Colorado |
52.5 |
|
Monona County, Iowa |
52.3 |
|
Cross County, Arkansas |
52.04 |
|
Keith County, Nebraska |
51.55 |
|
Todd County, Kentucky |
51.14 |
|
Logan County, North Dakota |
51.02 |
|
Jasper County, Indiana |
50.58 |
|
Pemiscot County, Missouri |
50.16 |
|
Castro County, Texas |
50.15 |
|
Pike County, Illinois |
49.84 |
|
Coahoma County, Mississippi |
49.08 |
|
Whitman County, Washington |
48.98 |
|
Glenn County, California |
48.62 |
|
Smith County, Kansas |
48.31 |
|
Merrick County, Nebraska |
47.97 |
|
Marshall County, Minnesota |
47.81 |
|
New Madrid County, Missouri |
46.44 |
|
Lane County, Kansas |
45.49 |
|
Randolph County, Arkansas |
44.34 |
|
Knox County, Texas |
44.07 |
|
Boone County, Iowa |
43.93 |
|
Haskell County, Texas |
43.59 |
|
Washington County, Mississippi |
43.54 |
|
Webster County, Nebraska |
43.31 |
|
Menard County, Illinois |
43.27 |
|
Faulk County, South Dakota |
43 |
|
Thayer County, Nebraska |
42.73 |
|
Hamlin County, South Dakota |
42.36 |
|
Jerauld County, South Dakota |
42.33 |
|
Adair County, Iowa |
42.02 |
|
Harlan County, Nebraska |
41.72 |
|
Burt County, Nebraska |
41.68 |
|
Union County, Kentucky |
41.64 |
|
Wells County, North Dakota |
41.41 |
|
Brule County, South Dakota |
40.5 |
|
Butler County, Nebraska |
40.48 |
|
Leflore County, Mississippi |
40.34 |
|
Ransom County, North Dakota |
40.29 |
|
Logan County, Kansas |
39.98 |
|
Cass County, Michigan |
38.67 |
|
Atchison County, Missouri |
37.87 |
|
Sheridan County, Montana |
37.04 |
|
Lewis County, Missouri |
36.53 |
|
Polk County, Nebraska |
36.39 |
|
Polk County, Minnesota |
35.65 |
|
Barnes County, North Dakota |
35.33 |
|
Butler County, Iowa |
34.6 |
|
Chariton County, Missouri |
34.55 |
|
Jewell County, Kansas |
34.49 |
|
Henry County, Illinois |
34.47 |
|
Gove County, Kansas |
33.47 |
|
Fountain County, Indiana |
32.94 |
|
Charles City County, Virginia |
32.92 |
|
St. Francis County, Arkansas |
32.69 |
|
Clarendon County, South Carolina |
32.62 |
|
Lonoke County, Arkansas |
32.46 |
|
Mississippi County, Arkansas |
32.27 |
|
Teton County, Montana |
31.64 |
|
Rice County, Kansas |
31.12 |
|
Palo Alto County, Iowa |
30.71 |
|
Pocahontas County, Iowa |
30.68 |
|
Warren County, Illinois |
30.47 |
|
Sutter County, California |
30.37 |
|
Gooding County, Idaho |
29.43 |
|
McCook County, South Dakota |
29.37 |
|
Grant County, Oklahoma |
29.25 |
|
Rush County, Kansas |
28.69 |
|
Morehouse Parish, Louisiana |
27.89 |
|
Huron County, Michigan |
27.69 |
|
Cuming County, Nebraska |
27.55 |
|
Perquimans County, North Carolina |
27.23 |
|
Marshall County, South Dakota |
27.09 |
|
Caldwell County, Missouri |
26.86 |
|
Lamb County, Texas |
26.63 |
|
Moore County, Texas |
26.61 |
|
Drew County, Arkansas |
26.5 |
|
Chippewa County, Minnesota |
25.61 |
|
Crittenden County, Arkansas |
25.59 |
|
Starke County, Indiana |
25.39 |
|
Knox County, Indiana |
25.32 |
|
Vermillion County, Indiana |
25.08 |
|
Gregory County, South Dakota |
24.52 |
|
Prowers County, Colorado |
24.42 |
|
Cass County, Nebraska |
24.36 |
|
Colorado County, Texas |
24.36 |
|
Greene County, North Carolina |
24.25 |
|
Caldwell County, Kentucky |
24 |
|
Scott County, Missouri |
23.94 |
|
Monroe County, Missouri |
23.79 |
|
Washington County, North Carolina |
23.45 |
|
Walla Walla County, Washington |
23.44 |
|
Sac County, Iowa |
23.06 |
|
Cherry County, Nebraska |
22.98 |
|
Blackford County, Indiana |
22.63 |
|
Wayne County, Illinois |
22.36 |
|
Saunders County, Nebraska |
22.19 |
|
Stutsman County, North Dakota |
22.15 |
|
Jefferson County, Idaho |
21.92 |
|
Dunklin County, Missouri |
21.65 |
|
Clay County, Illinois |
21.54 |
|
Phillips County, Kansas |
21.39 |
|
Calhoun County, Georgia |
21.37 |
|
Nuckolls County, Nebraska |
21.35 |
|
Iroquois County, Illinois |
21.31 |
|
Harper County, Kansas |
21.31 |
|
Moody County, South Dakota |
21.27 |
|
Cavalier County, North Dakota |
21.24 |
|
Douglas County, Washington |
21.15 |
|
Stanton County, Nebraska |
21.05 |
|
Saline County, Missouri |
20.89 |
|
Lewis County, Idaho |
20.8 |
|
Douglas County, Illinois |
20.69 |
|
Benton County, Iowa |
20.41 |
|
Clark County, Illinois |
20.4 |
|
Greene County, Iowa |
20.21 |
|
Edgar County, Illinois |
20.13 |
|
Turner County, South Dakota |
19.93 |
|
Clark County, Missouri |
19.84 |
|
Parke County, Indiana |
19.76 |
|
Cloud County, Kansas |
19.67 |
|
Benson County, North Dakota |
19.45 |
|
Posey County, Indiana |
19.42 |
|
Logan County, Kentucky |
19.33 |
|
Graham County, Kansas |
19.31 |
|
Lyon County, Iowa |
19.07 |
|
White County, Indiana |
18.76 |
|
Calhoun County, Iowa |
18.74 |
|
Obrien County, Iowa |
18.68 |
|
Finney County, Kansas |
18.43 |
|
Sanilac County, Michigan |
18.34 |
|
Clinton County, Indiana |
18.22 |
|
Dickinson County, Kansas |
18.08 |
|
Deaf Smith County, Texas |
17.92 |
|
Kent County, Maryland |
17.86 |
|
Bingham County, Idaho |
17.81 |
|
Logan County, Illinois |
17.54 |
|
Norton County, Kansas |
17.52 |
|
Moultrie County, Illinois |
17.39 |
|
Yuba County, California |
17.27 |
|
Maui + Kalawao County, Hawaii |
17.25 |
|
Holmes County, Mississippi |
17.24 |
|
Wharton County, Texas |
17.23 |
|
Grant County, Wisconsin |
17.21 |
|
Cherokee County, Kansas |
16.96 |
|
Woodford County, Illinois |
16.91 |
|
Mitchell County, Kansas |
16.82 |
|
DeKalb County, Illinois |
16.55 |
|
Pointe Coupee Parish, Louisiana |
16.48 |
|
Paulding County, Ohio |
16.44 |
|
Cooper County, Missouri |
16.39 |
|
Franklin Parish, Louisiana |
16.34 |
|
Wayne County, Nebraska |
16.33 |
|
Jackson County, Texas |
16.31 |
|
Nemaha County, Nebraska |
16.29 |
|
Daviess County, Indiana |
16.12 |
|
Wabash County, Indiana |
15.91 |
|
Tuscola County, Michigan |
15.85 |
|
Shelby County, Illinois |
15.83 |
|
Beaver County, Oklahoma |
15.55 |
|
Caribou County, Idaho |
15.33 |
|
Lee County, Illinois |
15.21 |
|
Reno County, Kansas |
14.82 |
|
Lafayette County, Wisconsin |
14.76 |
|
Dallas County, Iowa |
14.74 |
|
Caroline County, Virginia |
14.61 |
|
Washington County, Illinois |
14.6 |
|
Grant County, Washington |
14.54 |
|
Greene County, Illinois |
14.41 |
|
Lagrange County, Indiana |
14.25 |
|
Jackson County, Iowa |
14.22 |
|
Jackson County, Oklahoma |
14.07 |
|
Kauai County, Hawaii |
14.06 |
|
Willacy County, Texas |
14.05 |
|
Plymouth County, Iowa |
13.99 |
|
Wabash County, Illinois |
13.83 |
|
Dooly County, Georgia |
13.73 |
|
Texas County, Oklahoma |
13.72 |
|
Crawford County, Iowa |
13.69 |
|
Buena Vista County, Iowa |
13.36 |
|
Schuyler County, Illinois |
13.23 |
|
Barton County, Kansas |
13.22 |
|
Hardin County, Ohio |
13.19 |
|
Hill County, Texas |
13.01 |
|
Washington County, Iowa |
12.98 |
|
Carroll County, Iowa |
12.96 |
|
Butler County, Missouri |
12.84 |
|
Marion County, Illinois |
12.82 |
|
Morgan County, Colorado |
12.62 |
|
Northampton County, North Carolina |
12.55 |
|
Big Horn County, Wyoming |
12.42 |
|
Cass County, Iowa |
12.32 |
|
Mahaska County, Iowa |
11.91 |
|
Winnebago County, Iowa |
11.9 |
|
Clay County, Minnesota |
11.9 |
|
Crockett County, Tennessee |
11.89 |
|
Shelby County, Iowa |
11.85 |
|
Refugio County, Texas |
11.69 |
|
Grant County, Kansas |
11.56 |
|
Beaufort County, North Carolina |
11.45 |
|
Jefferson County, Oklahoma |
11.43 |
|
Clay County, Iowa |
11.42 |
|
Atchison County, Kansas |
11.42 |
|
Becker County, Minnesota |
11.42 |
|
Lincoln County, Nebraska |
11.35 |
|
Bailey County, Texas |
11.29 |
|
Greene County, Arkansas |
11.25 |
|
Graves County, Kentucky |
11.24 |
|
Jones County, Texas |
11.22 |
|
Otero County, Colorado |
11.17 |
|
Madison County, Nebraska |
11.13 |
|
Colfax County, Nebraska |
11.1 |
|
Big Horn County, Montana |
10.95 |
|
Goshen County, Wyoming |
10.81 |
|
Clark County, Arkansas |
10.69 |
|
Seward County, Kansas |
10.68 |
|
Cottonwood County, Minnesota |
10.66 |
|
Livingston County, Illinois |
10.6 |
|
Boone County, Indiana |
10.6 |
|
Kandiyohi County, Minnesota |
10.5 |
|
Nobles County, Minnesota |
10.48 |
|
Livingston County, Missouri |
10.35 |
|
Washington County, Nebraska |
10.35 |
|
Dillon County, South Carolina |
10.28 |
|
Asotin County, Washington |
10.11 |
|
Butte County, California |
10.1 |
|
Saline County, Illinois |
10.02 |
|
Mercer County, Ohio |
10.01 |
|
Scotts Bluff County, Nebraska |
9.85 |
|
Canyon County, Idaho |
9.79 |
|
Hertford County, North Carolina |
9.78 |
|
Currituck County, North Carolina |
9.62 |
|
McDonough County, Illinois |
9.61 |
|
Wayne County, Iowa |
9.61 |
|
Middlesex County, Virginia |
9.58 |
|
Franklin County, Washington |
9.58 |
|
Dorchester County, Maryland |
9.49 |
|
Vermilion County, Illinois |
9.42 |
|
Duplin County, North Carolina |
9.3 |
|
Henry County, Ohio |
9.3 |
|
Medina County, Texas |
9.3 |
|
Callaway County, Missouri |
9.22 |
|
Martin County, Minnesota |
9.17 |
|
Toole County, Montana |
9.06 |
|
Pope County, Minnesota |
8.96 |
|
Twin Falls County, Idaho |
8.86 |
|
Caddo County, Oklahoma |
8.84 |
|
Klickitat County, Washington |
8.84 |
|
Cass County, Illinois |
8.8 |
|
Decatur County, Iowa |
8.77 |
|
Orleans County, New York |
8.73 |
|
Ohio County, Kentucky |
8.69 |
|
Ramsey County, North Dakota |
8.48 |
|
Gibson County, Indiana |
8.45 |
|
Gaines County, Texas |
8.4 |
|
Tipton County, Tennessee |
8.24 |
|
Fulton County, Ohio |
8.23 |
|
Montgomery County, Indiana |
8.19 |
|
Dunn County, Wisconsin |
7.98 |
|
Butler County, Kentucky |
7.97 |
|
Chaves County, New Mexico |
7.94 |
|
Fayette County, Ohio |
7.91 |
|
Carson County, Texas |
7.9 |
|
Cheyenne County, Nebraska |
7.89 |
|
Henry County, Indiana |
7.86 |
|
Brown County, Illinois |
7.82 |
|
Spencer County, Indiana |
7.69 |
|
Gratiot County, Michigan |
7.68 |
|
St. Joseph County, Michigan |
7.67 |
|
Louisa County, Iowa |
7.64 |
|
Pickaway County, Ohio |
7.63 |
|
Gage County, Nebraska |
7.59 |
|
Livingston County, New York |
7.59 |
|
Westmoreland County, Virginia |
7.59 |
|
Sandusky County, Ohio |
7.47 |
|
Bonneville County, Idaho |
7.44 |
|
Carroll County, Tennessee |
7.25 |
|
Brown County, Minnesota |
7.24 |
|
Goodhue County, Minnesota |
7.15 |
|
Wilson County, North Carolina |
7.08 |
|
Decatur County, Indiana |
7.02 |
|
Northumberland County, Pennsylvania |
6.99 |
|
Crawford County, Ohio |
6.95 |
|
Bremer County, Iowa |
6.91 |
|
Floyd County, Iowa |
6.91 |
|
Kosciusko County, Indiana |
6.9 |
|
Miami County, Indiana |
6.87 |
|
Panola County, Mississippi |
6.87 |
|
Christian County, Kentucky |
6.86 |
|
Fayette County, Iowa |
6.76 |
|
Uvalde County, Texas |
6.71 |
|
Nemaha County, Kansas |
6.58 |
|
Montgomery County, Kansas |
6.52 |
|
Frio County, Texas |
6.51 |
|
Gibson County, Tennessee |
6.42 |
|
Grand Forks County, North Dakota |
6.38 |
|
Greene County, Indiana |
6.36 |
|
Pottawatomie County, Kansas |
6.25 |
|
Freeborn County, Minnesota |
6.17 |
|
Dyer County, Tennessee |
6.13 |
|
Wyandot County, Ohio |
6.04 |
|
Henderson County, Kentucky |
5.94 |
|
Latah County, Idaho |
5.93 |
|
Fillmore County, Minnesota |
5.91 |
|
Clay County, South Dakota |
5.89 |
|
Lenawee County, Michigan |
5.88 |
|
Malheur County, Oregon |
5.8 |
|
Story County, Iowa |
5.73 |
|
Ford County, Illinois |
5.7 |
|
Sussex County, Delaware |
5.65 |
|
Hall County, Nebraska |
5.64 |
|
Jefferson County, Wisconsin |
5.57 |
|
Avoyelles Parish, Louisiana |
5.53 |
|
Calumet County, Wisconsin |
5.51 |
|
Mower County, Minnesota |
5.5 |
|
Cass County, Indiana |
5.49 |
|
Vernon County, Missouri |
5.48 |
|
Preble County, Ohio |
5.4 |
|
Harrison County, Indiana |
5.34 |
|
Miller County, Arkansas |
5.22 |
|
Yolo County, California |
5.22 |
|
Union County, Oregon |
5.21 |
|
Dawson County, Texas |
5.2 |
|
Hale County, Texas |
5.17 |
|
Imperial County, California |
5.13 |
|
Marion County, Missouri |
5.12 |
|
Davison County, South Dakota |
5.12 |
|
Cayuga County, New York |
5.11 |
|
Huron County, Ohio |
5.05 |
|
Sangamon County, Illinois |
5.04 |
|
Morton County, North Dakota |
5.04 |
|
Merced County, California |
4.98 |
|
Union County, South Dakota |
4.94 |
|
Brazoria County, Texas |
4.9 |
|
Chickasaw County, Iowa |
4.87 |
|
Codington County, South Dakota |
4.81 |
|
Washington County, Indiana |
4.79 |
|
Ventura County, California |
4.71 |
|
Jackson County, Indiana |
4.63 |
|
Pennington County, Minnesota |
4.63 |
|
Jackson County, Minnesota |
4.59 |
|
Williamsburg County, South Carolina |
4.59 |
|
Champaign County, Ohio |
4.58 |
|
Waller County, Texas |
4.56 |
|
Kings County, California |
4.54 |
|
Bond County, Illinois |
4.42 |
|
Accomack County, Virginia |
4.37 |
|
Wasco County, Oregon |
4.31 |
|
Delaware County, Indiana |
4.26 |
|
Pottawattamie County, Iowa |
4.26 |
|
Robertson County, Tennessee |
4.24 |
|
Weld County, Colorado |
4.22 |
|
Bourbon County, Kentucky |
4.22 |
|
Darke County, Ohio |
4.19 |
|
Blaine County, Idaho |
4.15 |
|
Tippecanoe County, Indiana |
4.15 |
|
Vermilion Parish, Louisiana |
4.15 |
|
Platte County, Nebraska |
4.13 |
|
Arenac County, Michigan |
4.05 |
|
Le Sueur County, Minnesota |
4.02 |
|
Jo Daviess County, Illinois |
3.99 |
|
Craighead County, Arkansas |
3.98 |
|
Hillsdale County, Michigan |
3.98 |
|
Cass County, North Dakota |
3.96 |
|
Caroline County, Maryland |
3.91 |
|
Yakima County, Washington |
3.89 |
|
Jackson County, Illinois |
3.79 |
|
Queen Anne's County, Maryland |
3.73 |
|
Yankton County, South Dakota |
3.66 |
|
Coles County, Illinois |
3.62 |
|
Monroe County, Michigan |
3.62 |
|
Green County, Wisconsin |
3.57 |
|
Lee County, Iowa |
3.55 |
|
Trempealeau County, Wisconsin |
3.54 |
|
Lyon County, Minnesota |
3.5 |
|
Peoria County, Illinois |
3.46 |
|
San Joaquin County, California |
3.43 |
|
Randolph County, Indiana |
3.43 |
|
Robeson County, North Carolina |
3.42 |
|
Indiana County, Pennsylvania |
3.42 |
|
Liberty County, Texas |
3.41 |
|
Clinton County, Iowa |
3.39 |
|
Terry County, Texas |
3.33 |
|
Keokuk County, Iowa |
3.32 |
|
DeKalb County, Indiana |
3.14 |
|
Johnson County, Indiana |
3.12 |
|
Webster County, Iowa |
3.11 |
|
Clayton County, Iowa |
3.04 |
|
Blue Earth County, Minnesota |
3.04 |
|
Clay County, Indiana |
3.01 |
|
Wabasha County, Minnesota |
2.95 |
|
Lapeer County, Michigan |
2.93 |
|
Obion County, Tennessee |
2.93 |
|
Tulare County, California |
2.92 |
|
Licking County, Ohio |
2.9 |
|
Clinton County, Michigan |
2.88 |
|
Huntington County, Indiana |
2.87 |
|
Monroe County, Illinois |
2.85 |
|
Caldwell County, Texas |
2.85 |
|
McKenzie County, North Dakota |
2.84 |
|
Calloway County, Kentucky |
2.81 |
|
Chowan County, North Carolina |
2.81 |
|
Union County, North Carolina |
2.76 |
|
Madison County, Ohio |
2.76 |
|
Bee County, Texas |
2.76 |
|
LaPorte County, Indiana |
2.72 |
|
LaSalle County, Illinois |
2.71 |
|
Kankakee County, Illinois |
2.68 |
|
Curry County, New Mexico |
2.68 |
|
Douglas County, Minnesota |
2.67 |
|
Wayne County, New York |
2.65 |
|
Dubois County, Indiana |
2.64 |
|
Yuma County, Arizona |
2.61 |
|
Shelby County, Kentucky |
2.61 |
|
Laramie County, Wyoming |
2.61 |
|
Madison County, Indiana |
2.53 |
|
Benton County, Washington |
2.46 |
|
Rock County, Wisconsin |
2.44 |
|
McLean County, Illinois |
2.42 |
|
Daviess County, Kentucky |
2.34 |
|
Guadalupe County, Texas |
2.33 |
|
Lubbock County, Texas |
2.33 |
|
Woodbury County, Iowa |
2.31 |
|
Sauk County, Wisconsin |
2.31 |
|
Lowndes County, Mississippi |
2.19 |
|
Black Hawk County, Iowa |
2.14 |
|
Lycoming County, Pennsylvania |
2.13 |
|
Barron County, Wisconsin |
2.13 |
|
Jay County, Indiana |
2.08 |
|
Clinton County, Ohio |
2.08 |
|
Marion County, Ohio |
2.03 |
|
Seneca County, Ohio |
2.02 |
|
Cochise County, Arizona |
2 |
|
Honolulu County, Hawaii |
2 |
|
Otter Tail County, Minnesota |
1.96 |
|
Manitowoc County, Wisconsin |
1.92 |
|
Stanly County, North Carolina |
1.91 |
|
Kent County, Delaware |
1.89 |
|
Johnston County, North Carolina |
1.85 |
|
Fannin County, Texas |
1.81 |
|
Macon County, Illinois |
1.77 |
|
Adams County, Pennsylvania |
1.73 |
|
St. Landry Parish, Louisiana |
1.7 |
|
Kendall County, Illinois |
1.69 |
|
Kay County, Oklahoma |
1.69 |
|
Allen County, Indiana |
1.68 |
|
Okanogan County, Washington |
1.67 |
|
Vanderburgh County, Indiana |
1.66 |
|
Calcasieu Parish, Louisiana |
1.62 |
|
Stark County, North Dakota |
1.62 |
|
Cascade County, Montana |
1.61 |
|
Hidalgo County, Texas |
1.61 |
|
Scott County, Minnesota |
1.59 |
|
Ellis County, Texas |
1.59 |
|
Hendricks County, Indiana |
1.58 |
|
Madison County, Illinois |
1.55 |
|
Kalamazoo County, Michigan |
1.52 |
|
Cerro Gordo County, Iowa |
1.5 |
|
Larimer County, Colorado |
1.49 |
|
White County, Arkansas |
1.47 |
|
Porter County, Indiana |
1.44 |
|
Bay County, Michigan |
1.4 |
|
Tazewell County, Illinois |
1.36 |
|
Fayette County, Texas |
1.36 |
|
St. Clair County, Illinois |
1.35 |
|
Adams County, Indiana |
1.34 |
|
Sumter County, South Carolina |
1.33 |
|
St. Croix County, Wisconsin |
1.33 |
|
Champaign County, Illinois |
1.32 |
|
Pettis County, Missouri |
1.32 |
|
Grant County, Indiana |
1.3 |
|
St. Joseph County, Indiana |
1.28 |
|
Schuylkill County, Pennsylvania |
1.28 |
|
Scott County, Iowa |
1.24 |
|
Saginaw County, Michigan |
1.23 |
|
Williams County, North Dakota |
1.21 |
|
Jackson County, Michigan |
1.18 |
|
Columbus County, North Carolina |
1.16 |
|
Union County, Ohio |
1.16 |
|
Dane County, Wisconsin |
1.15 |
|
Salem County, New Jersey |
1.12 |
|
Franklin County, Missouri |
1.09 |
|
Lancaster County, Pennsylvania |
1.07 |
|
McLeod County, Minnesota |
1.04 |
|
Victoria County, Texas |
1.04 |
|
Fairfield County, Ohio |
1.03 |
|
Dakota County, Minnesota |
1.02 |
|
Cape Girardeau County, Missouri |
1.02 |
|
Unknown Or Undefined, Michigan |
1.01 |
|
York County, Pennsylvania |
0.99 |
|
Genesee County, Michigan |
0.97 |
|
St. Charles County, Missouri |
0.97 |
|
Racine County, Wisconsin |
0.97 |
|
Columbia County, Wisconsin |
0.96 |
|
Dodge County, Wisconsin |
0.96 |
|
Miami County, Ohio |
0.95 |
|
Solano County, California |
0.94 |
|
Boone County, Missouri |
0.92 |
|
Warren County, New Jersey |
0.92 |
|
Grayson County, Texas |
0.92 |
|
Skagit County, Washington |
0.9 |
|
Hopkins County, Kentucky |
0.88 |
|
Flathead County, Montana |
0.88 |
|
Rowan County, North Carolina |
0.88 |
|
Spokane County, Washington |
0.81 |
|
Berrien County, Michigan |
0.8 |
|
Stearns County, Minnesota |
0.79 |
|
Sarpy County, Nebraska |
0.79 |
|
Brown County, Wisconsin |
0.79 |
|
Des Moines County, Iowa |
0.78 |
|
Eaton County, Michigan |
0.76 |
|
Warren County, Ohio |
0.76 |
|
Minnehaha County, South Dakota |
0.75 |
|
Suffolk City, Virginia |
0.72 |
|
Stanislaus County, California |
0.71 |
|
Randall County, Texas |
0.7 |
|
Linn County, Iowa |
0.69 |
|
Harford County, Maryland |
0.68 |
|
Platte County, Missouri |
0.68 |
|
Bell County, Texas |
0.67 |
|
Hardin County, Kentucky |
0.66 |
|
Lorain County, Ohio |
0.66 |
|
Jefferson County, Texas |
0.66 |
|
Nueces County, Texas |
0.66 |
|
Chester County, Pennsylvania |
0.56 |
|
Frederick County, Maryland |
0.55 |
|
Cameron County, Texas |
0.54 |
|
McCracken County, Kentucky |
0.53 |
|
Unknown Or Undefined, Illinois |
0.52 |
|
McLennan County, Texas |
0.52 |
|
Placer County, California |
0.5 |
|
Wright County, Minnesota |
0.5 |
|
Bowie County, Texas |
0.5 |
|
Virginia Beach City, Virginia |
0.49 |
|
Lake County, Indiana |
0.47 |
|
Polk County, Iowa |
0.46 |
|
Winnebago County, Illinois |
0.44 |
|
Ontario County, New York |
0.44 |
|
Northampton County, Pennsylvania |
0.43 |
|
Wichita County, Texas |
0.43 |
|
Clay County, Missouri |
0.42 |
|
Marin County, California |
0.41 |
|
Olmsted County, Minnesota |
0.41 |
|
Craven County, North Carolina |
0.4 |
|
Will County, Illinois |
0.38 |
|
Hinds County, Mississippi |
0.38 |
|
Unknown Or Undefined, Minnesota |
0.34 |
|
Unknown Or Undefined, Missouri |
0.34 |
|
Marathon County, Wisconsin |
0.33 |
|
Tom Green County, Texas |
0.32 |
|
Kern County, California |
0.31 |
|
Sacramento County, California |
0.31 |
|
Ingham County, Michigan |
0.3 |
|
Lancaster County, Nebraska |
0.28 |
|
Fresno County, California |
0.27 |
|
Delaware County, Ohio |
0.27 |
|
Lucas County, Ohio |
0.25 |
|
Fort Bend County, Texas |
0.24 |
|
Unknown Or Undefined, Indiana |
0.23 |
|
Baltimore County, Maryland |
0.19 |
|
Howard County, Maryland |
0.19 |
|
Douglas County, Nebraska |
0.19 |
|
Westmoreland County, Pennsylvania |
0.19 |
|
Unknown Or Undefined, Texas |
0.19 |
|
Fayette County, Kentucky |
0.18 |
|
Loudoun County, Virginia |
0.18 |
|
Contra Costa County, California |
0.17 |
|
Montgomery County, Maryland |
0.16 |
|
Potter County, Texas |
0.16 |
|
Kent County, Michigan |
0.15 |
|
Pulaski County, Arkansas |
0.14 |
|
Berks County, Pennsylvania |
0.14 |
|
Chesapeake City, Virginia |
0.13 |
|
Shasta County, California |
0.12 |
|
Shawnee County, Kansas |
0.11 |
|
Maricopa County, Arizona |
0.07 |
|
Hennepin County, Minnesota |
0.02 |
|
Los Angeles County, California |
0.01 |
|
Cook County, Illinois |
0.01 |
|
Dallas County, Texas |
0.01 |
|
Source: U.S. Bureau of Labor Statistics, Quarterly Census of Employment and Wages. |
|
Note: The North American Industry Classification System groups this industry under “animal production and aquaculture.” The OES survey excludes most of the agricultural sector, with the exception of logging, support activities for crop production, and support activities for animal production. The OES survey does not include the animal production and aquaculture industry; therefore, occupation location quotients cannot be calculated.
| County | Location quotient |
|---|---|
|
Wheeler County, Nebraska |
258.91 |
|
Hamilton County, Kansas |
220.31 |
|
Grant County, Nebraska |
195.29 |
|
Texas County, Oklahoma |
190.32 |
|
Haskell County, Kansas |
171.75 |
|
Roberts County, Texas |
167.59 |
|
Sherman County, Texas |
166.75 |
|
Castro County, Texas |
155.11 |
|
Blaine County, Nebraska |
131.8 |
|
Gooding County, Idaho |
131.42 |
| Source: U.S. Bureau of Labor Statistics, Quarterly Census of Employment and Wages. | |

| County | Location quotient |
|---|---|
|
Wheeler County, Nebraska |
258.91 |
|
Hamilton County, Kansas |
220.31 |
|
Grant County, Nebraska |
195.29 |
|
Texas County, Oklahoma |
190.32 |
|
Haskell County, Kansas |
171.75 |
|
Roberts County, Texas |
167.59 |
|
Sherman County, Texas |
166.75 |
|
Castro County, Texas |
155.11 |
|
Blaine County, Nebraska |
131.8 |
|
Gooding County, Idaho |
131.42 |
|
Jerome County, Idaho |
121.01 |
|
Lincoln County, Idaho |
116.32 |
|
Cimarron County, Oklahoma |
114.96 |
|
Hartley County, Texas |
105.48 |
|
Dallam County, Texas |
104.81 |
|
Hayes County, Nebraska |
99.48 |
|
Sibley County, Minnesota |
99.27 |
|
Meagher County, Montana |
97.76 |
|
Camp County, Texas |
95.91 |
|
Scott County, Kansas |
95.1 |
|
Wichita County, Kansas |
93.31 |
|
Bailey County, Texas |
89.65 |
|
Deaf Smith County, Texas |
88.87 |
|
Audubon County, Iowa |
88.32 |
|
Parmer County, Texas |
84.55 |
|
Owyhee County, Idaho |
83.26 |
|
Hodgeman County, Kansas |
81.06 |
|
Roosevelt County, New Mexico |
80.07 |
|
Meade County, Kansas |
78.64 |
|
Gray County, Kansas |
78.31 |
|
Hansford County, Texas |
72.35 |
|
Marshall County, South Dakota |
72.14 |
|
Osceola County, Iowa |
70.72 |
|
Lamb County, Texas |
68.83 |
|
Bent County, Colorado |
68.44 |
|
Jackson County, Colorado |
67.66 |
|
Aurora County, South Dakota |
67.5 |
|
Lane County, Kansas |
67.34 |
|
Stevens County, Minnesota |
64.66 |
|
Comanche County, Texas |
63.69 |
|
Yuma County, Colorado |
63.53 |
|
Boone County, Nebraska |
59.86 |
|
Sterling County, Texas |
58.62 |
|
Lafayette County, Florida |
58.55 |
|
Moody County, South Dakota |
58.47 |
|
Swisher County, Texas |
58.14 |
|
Phillips County, Colorado |
56.52 |
|
Missaukee County, Michigan |
56.35 |
|
Kewaunee County, Wisconsin |
55.82 |
|
Paulding County, Ohio |
55.05 |
|
Cuming County, Nebraska |
53.94 |
|
Polk County, Nebraska |
51.18 |
|
Cassia County, Idaho |
51.07 |
|
McLean County, Kentucky |
50.34 |
|
Newton County, Indiana |
49.66 |
|
Gilchrist County, Florida |
48.6 |
|
Renville County, Minnesota |
48.45 |
|
Lyon County, Iowa |
48.14 |
|
Sheridan County, Nebraska |
47.05 |
|
Greeley County, Nebraska |
46.81 |
|
Decatur County, Kansas |
46.65 |
|
Loup County, Nebraska |
46.13 |
|
Motley County, Texas |
46 |
|
Custer County, Nebraska |
45.95 |
|
Sampson County, North Carolina |
45.85 |
|
Borden County, Texas |
45.53 |
|
Cheyenne County, Kansas |
44.74 |
|
Furnas County, Nebraska |
44.2 |
|
Millard County, Utah |
43.99 |
|
Curry County, New Mexico |
43.84 |
|
Morrill County, Nebraska |
43.52 |
|
Kenedy County, Texas |
42.64 |
|
Hamilton County, Iowa |
41.52 |
|
Okeechobee County, Florida |
41.32 |
|
Kit Carson County, Colorado |
41.17 |
|
Kearny County, Kansas |
40.78 |
|
Gonzales County, Texas |
40.66 |
|
Hyde County, South Dakota |
40.36 |
|
McMullen County, Texas |
39.65 |
|
Lafayette County, Wisconsin |
39.14 |
|
Lipscomb County, Texas |
38.42 |
|
Pipestone County, Minnesota |
38.27 |
|
Towner County, North Dakota |
38.25 |
|
Duplin County, North Carolina |
37.96 |
|
Edwards County, Texas |
37.26 |
|
Cherry County, Nebraska |
37 |
|
Hamlin County, South Dakota |
36.87 |
|
Morrow County, Oregon |
36.58 |
|
Stanton County, Nebraska |
36.46 |
|
Dundy County, Nebraska |
36.12 |
|
Sheridan County, Kansas |
35.46 |
|
Grant County, Kansas |
34.82 |
|
Winnebago County, Iowa |
34.52 |
|
Hancock County, Illinois |
34.44 |
|
Dickens County, Texas |
34.36 |
|
Cottle County, Texas |
34 |
|
Washington County, Colorado |
33.98 |
|
Brown County, Nebraska |
33.97 |
|
Greeley County, Kansas |
33.39 |
|
Donley County, Texas |
33.31 |
|
Amelia County, Virginia |
33.12 |
|
Hamilton County, Texas |
33.08 |
|
Beaverhead County, Montana |
33.04 |
|
Lake County, Oregon |
33.03 |
|
Oldham County, Texas |
32.86 |
|
Camuy Municipio, Puerto Rico |
32.5 |
|
Antelope County, Nebraska |
32.44 |
|
Franklin County, Idaho |
31.9 |
|
Washington County, Kansas |
31.62 |
|
Wright County, Iowa |
31.45 |
|
Harmon County, Oklahoma |
31.3 |
|
Moniteau County, Missouri |
31.14 |
|
Gove County, Kansas |
30.89 |
|
Wyoming County, New York |
30.88 |
|
Chase County, Nebraska |
30.68 |
|
Tillman County, Oklahoma |
30.55 |
|
Clinton County, Illinois |
30.51 |
|
Brooks County, Georgia |
30.45 |
|
Macon County, Georgia |
30.33 |
|
Huron County, Michigan |
29.93 |
|
Robertson County, Texas |
29.66 |
|
Turner County, South Dakota |
29.6 |
|
McPherson County, South Dakota |
29.43 |
|
Holt County, Nebraska |
28.73 |
|
Harlan County, Nebraska |
28.7 |
|
Hand County, South Dakota |
28.14 |
|
Morgan County, Colorado |
27.97 |
|
Putnam County, Georgia |
27.88 |
|
Colfax County, Nebraska |
27.87 |
|
Pulaski County, Indiana |
27.84 |
|
Stafford County, Kansas |
27.68 |
|
Bledsoe County, Tennessee |
27.56 |
|
Liberty County, Montana |
27.42 |
|
Minidoka County, Idaho |
27.27 |
|
Clark County, Wisconsin |
27.13 |
|
Ionia County, Michigan |
27.1 |
|
Jones County, North Carolina |
27.09 |
|
Buffalo County, Wisconsin |
26.69 |
|
Phillips County, Kansas |
26.6 |
|
Chickasaw County, Iowa |
26.27 |
|
Naguabo Municipio, Puerto Rico |
26.24 |
|
Chaves County, New Mexico |
25.82 |
|
Edmunds County, South Dakota |
25.75 |
|
Cedar County, Nebraska |
25.66 |
|
Pepin County, Wisconsin |
25.41 |
|
Tillamook County, Oregon |
25.32 |
|
Rice County, Kansas |
25.11 |
|
Clay County, Nebraska |
25.09 |
|
Sioux County, Iowa |
24.95 |
|
Socorro County, New Mexico |
24.9 |
|
Saluda County, South Carolina |
24.81 |
|
Lincoln County, Minnesota |
24.8 |
|
Buena Vista County, Iowa |
24.74 |
|
Clark County, South Dakota |
24.72 |
|
Jasper County, Illinois |
24.71 |
|
Bourbon County, Kentucky |
24.69 |
|
Mason County, Texas |
24.63 |
|
Hatillo Municipio, Puerto Rico |
24.56 |
|
Edwards County, Kansas |
24.38 |
|
Kings County, California |
24.3 |
|
Oglethorpe County, Georgia |
24.26 |
|
Harney County, Oregon |
24.2 |
|
Phelps County, Nebraska |
24.11 |
|
Cottonwood County, Minnesota |
23.97 |
|
Butler County, Nebraska |
23.93 |
|
San Saba County, Texas |
23.88 |
|
Erath County, Texas |
23.85 |
|
Cheyenne County, Colorado |
23.71 |
|
Northampton County, Virginia |
23.49 |
|
Hardeman County, Texas |
23.45 |
|
Boyd County, Nebraska |
23.44 |
|
Jeff Davis County, Texas |
23.4 |
|
Hooker County, Nebraska |
23.3 |
|
Taylor County, Iowa |
23.28 |
|
Pawnee County, Kansas |
23.19 |
|
Hardin County, Iowa |
23.17 |
|
Prowers County, Colorado |
23.14 |
|
Pocahontas County, Iowa |
23.08 |
|
Moore County, Texas |
23.04 |
|
Elmore County, Idaho |
22.9 |
|
Clarke County, Iowa |
22.64 |
|
Allamakee County, Iowa |
22.57 |
|
Merced County, California |
22.4 |
|
Brown County, Minnesota |
22.4 |
|
Madison County, Montana |
22.22 |
|
Union County, New Mexico |
21.67 |
|
Benton County, Indiana |
21.57 |
|
Oconto County, Wisconsin |
21.39 |
|
McIntosh County, North Dakota |
21.13 |
|
Blaine County, Montana |
20.95 |
|
Hale County, Alabama |
20.84 |
|
Martin County, Minnesota |
20.84 |
|
Platte County, Wyoming |
20.8 |
|
Nelson County, North Dakota |
20.67 |
|
Hutchinson County, South Dakota |
20.62 |
|
Mellette County, South Dakota |
20.2 |
|
Archer County, Texas |
20.14 |
|
Tulare County, California |
20.11 |
|
Marquette County, Wisconsin |
19.93 |
|
Mills County, Texas |
19.79 |
|
Twin Falls County, Idaho |
19.55 |
|
Knox County, Nebraska |
19.52 |
|
Lewis County, New York |
19.43 |
|
Covington County, Mississippi |
19.42 |
|
Dodge County, Minnesota |
19.37 |
|
San Sebastian Municipio, Puerto Rico |
19.37 |
|
Van Buren County, Iowa |
19.36 |
|
Addison County, Vermont |
19.35 |
|
Sierra County, New Mexico |
19.28 |
|
Jasper County, Indiana |
19.2 |
|
Prairie County, Arkansas |
19.14 |
|
Grant County, South Dakota |
19.07 |
|
McHenry County, North Dakota |
19.06 |
|
Bandera County, Texas |
19 |
|
Jefferson County, Nebraska |
18.87 |
|
Adams County, Washington |
18.81 |
|
Taylor County, Wisconsin |
18.77 |
|
Kingsbury County, South Dakota |
18.73 |
|
Fillmore County, Minnesota |
18.62 |
|
Rock County, Nebraska |
18.57 |
|
Mora County, New Mexico |
18.49 |
|
Modoc County, California |
18.32 |
|
Kossuth County, Iowa |
18.04 |
|
Brooks County, Texas |
18.03 |
|
Levy County, Florida |
17.78 |
|
Zavala County, Texas |
17.71 |
|
Emmet County, Iowa |
17.6 |
|
McDonald County, Missouri |
17.57 |
|
Stonewall County, Texas |
17.56 |
|
Lajas Municipio, Puerto Rico |
17.41 |
|
Decatur County, Iowa |
17.36 |
|
Wabasha County, Minnesota |
17.36 |
|
Churchill County, Nevada |
17.35 |
|
Wabash County, Indiana |
17.25 |
|
Clinton County, Michigan |
17.13 |
|
Nemaha County, Kansas |
17.09 |
|
Garfield County, Nebraska |
16.82 |
|
Palo Alto County, Iowa |
16.8 |
|
Calumet County, Wisconsin |
16.77 |
|
Shawano County, Wisconsin |
16.76 |
|
Hemphill County, Texas |
16.74 |
|
Kandiyohi County, Minnesota |
16.69 |
|
Fayette County, Iowa |
16.6 |
|
Gratiot County, Michigan |
16.44 |
|
Grant County, Oregon |
16.41 |
|
Frontier County, Nebraska |
16.4 |
|
Wayne County, Nebraska |
16.4 |
|
Charles Mix County, South Dakota |
16.37 |
|
Pope County, Minnesota |
16.36 |
|
Wheeler County, Texas |
16.33 |
|
Teton County, Montana |
16.31 |
|
Sweet Grass County, Montana |
16.2 |
|
Baylor County, Texas |
16.17 |
|
Chouteau County, Montana |
16.15 |
|
Jefferson County, Oklahoma |
16.15 |
|
Darke County, Ohio |
16.01 |
|
Hale County, Texas |
15.91 |
|
Catron County, New Mexico |
15.84 |
|
Barry County, Michigan |
15.83 |
|
Burt County, Nebraska |
15.83 |
|
Sutton County, Texas |
15.67 |
|
Blanco County, Texas |
15.6 |
|
Custer County, Idaho |
15.47 |
|
Clayton County, Iowa |
15.46 |
|
Madera County, California |
15.38 |
|
Morrison County, Minnesota |
15.34 |
|
Essex County, Vermont |
15.28 |
|
Calhoun County, Georgia |
15.25 |
|
Meeker County, Minnesota |
15.16 |
|
Manitowoc County, Wisconsin |
14.97 |
|
Goliad County, Texas |
14.94 |
|
Sanilac County, Michigan |
14.85 |
|
Grand Isle County, Vermont |
14.81 |
|
Nance County, Nebraska |
14.76 |
|
Clay County, Texas |
14.66 |
|
Grant County, Wisconsin |
14.61 |
|
Douglas County, South Dakota |
14.47 |
|
Keith County, Nebraska |
14.39 |
|
Quebradillas Municipio, Puerto Rico |
14.31 |
|
Real County, Texas |
14.28 |
|
Gregory County, South Dakota |
14.25 |
|
Fayette County, Texas |
14.25 |
|
Franklin County, Vermont |
14.25 |
|
Wharton County, Texas |
14.19 |
|
Chase County, Kansas |
14.1 |
|
Terrell County, Texas |
14.06 |
|
Howard County, Iowa |
13.96 |
|
Woodford County, Kentucky |
13.94 |
|
Kinney County, Texas |
13.92 |
|
Sharkey County, Mississippi |
13.85 |
|
Washington County, Iowa |
13.82 |
|
Thomas County, Kansas |
13.82 |
|
Broadwater County, Montana |
13.74 |
|
Kearney County, Nebraska |
13.66 |
|
Richland County, Wisconsin |
13.66 |
|
Livingston County, New York |
13.57 |
|
Pike County, Illinois |
13.43 |
|
Rock County, Minnesota |
13.37 |
|
McCook County, South Dakota |
13.36 |
|
Howard County, Nebraska |
13.19 |
|
Hardee County, Florida |
13.13 |
|
Jefferson County, Florida |
13.12 |
|
Morris County, Kansas |
13.09 |
|
Jefferson County, Idaho |
13.08 |
|
Bosque County, Texas |
13.06 |
|
Wallowa County, Oregon |
12.97 |
|
Madison County, Florida |
12.9 |
|
Franklin County, Iowa |
12.81 |
|
Weld County, Colorado |
12.72 |
|
Genesee County, New York |
12.7 |
|
Rusk County, Wisconsin |
12.69 |
|
Bowman County, North Dakota |
12.65 |
|
Powell County, Montana |
12.64 |
|
Harrison County, Missouri |
12.6 |
|
Knox County, Texas |
12.58 |
|
Tripp County, South Dakota |
12.56 |
|
Park County, Montana |
12.52 |
|
Madison County, Iowa |
12.45 |
|
Bladen County, North Carolina |
12.4 |
|
Pinal County, Arizona |
12.31 |
|
Buchanan County, Iowa |
12.29 |
|
Nicollet County, Minnesota |
12.27 |
|
Cayuga County, New York |
12.24 |
|
Milam County, Texas |
12.19 |
|
Winneshiek County, Iowa |
12.17 |
|
Hancock County, Iowa |
12.16 |
|
Todd County, Minnesota |
12.13 |
|
Nobles County, Minnesota |
12.07 |
|
Shelby County, Missouri |
11.97 |
|
Mitchell County, Iowa |
11.94 |
|
Merrick County, Nebraska |
11.94 |
|
Potter County, South Dakota |
11.9 |
|
Schuyler County, Illinois |
11.89 |
|
Coal County, Oklahoma |
11.89 |
|
Henry County, Tennessee |
11.87 |
|
Lafayette County, Arkansas |
11.83 |
|
Big Horn County, Montana |
11.83 |
|
Columbia County, New York |
11.74 |
|
Dawson County, Nebraska |
11.73 |
|
Schuyler County, New York |
11.71 |
|
Grady County, Oklahoma |
11.7 |
|
Garfield County, Utah |
11.7 |
|
White County, Indiana |
11.69 |
|
Calhoun County, Iowa |
11.65 |
|
Carbon County, Wyoming |
11.63 |
|
Shelby County, Texas |
11.6 |
|
Dimmit County, Texas |
11.56 |
|
Schleicher County, Texas |
11.55 |
|
Payette County, Idaho |
11.53 |
|
Montgomery County, Iowa |
11.48 |
|
Houston County, Minnesota |
11.47 |
|
Hempstead County, Arkansas |
11.44 |
|
Greenwood County, Kansas |
11.43 |
|
Faribault County, Minnesota |
11.39 |
|
Concho County, Texas |
11.39 |
|
Converse County, Wyoming |
11.38 |
|
Keokuk County, Iowa |
11.35 |
|
Sanpete County, Utah |
11.28 |
|
Osceola County, Michigan |
11.26 |
|
Monroe County, Missouri |
11.25 |
|
Custer County, Montana |
11.24 |
|
Vernon County, Wisconsin |
11.24 |
|
Jay County, Indiana |
11.22 |
|
Morovis Municipio, Puerto Rico |
11.21 |
|
Newaygo County, Michigan |
11.07 |
|
Franklin County, Texas |
10.98 |
|
Carbon County, Montana |
10.94 |
|
Allegan County, Michigan |
10.93 |
|
Perry County, Pennsylvania |
10.93 |
|
Live Oak County, Texas |
10.92 |
|
Clay County, Iowa |
10.9 |
|
Sierra County, California |
10.86 |
|
Juniata County, Pennsylvania |
10.81 |
|
Howard County, Arkansas |
10.71 |
|
Hudspeth County, Texas |
10.71 |
|
Torrance County, New Mexico |
10.69 |
|
Iroquois County, Illinois |
10.62 |
|
Morgan County, Utah |
10.62 |
|
Obrien County, Iowa |
10.52 |
|
Atchison County, Missouri |
10.47 |
|
Goshen County, Wyoming |
10.47 |
|
Phillips County, Montana |
10.45 |
|
Pierce County, Wisconsin |
10.45 |
|
Corson County, South Dakota |
10.4 |
|
Clarke County, Virginia |
10.38 |
|
Sublette County, Wyoming |
10.36 |
|
Ogemaw County, Michigan |
10.33 |
|
Waseca County, Minnesota |
10.31 |
|
Suwannee County, Florida |
10.25 |
|
Waushara County, Wisconsin |
10.13 |
|
Shackelford County, Texas |
10.12 |
|
Leon County, Texas |
10.1 |
|
Benton County, Iowa |
10.07 |
|
Clay County, Illinois |
10.06 |
|
Yellow Medicine County, Minnesota |
10 |
|
Rosebud County, Montana |
9.97 |
|
Canyon County, Idaho |
9.93 |
|
Smith County, Kansas |
9.91 |
|
Humboldt County, Iowa |
9.86 |
|
Stephenson County, Illinois |
9.85 |
|
Woodford County, Illinois |
9.85 |
|
Stanislaus County, California |
9.83 |
|
Brookings County, South Dakota |
9.83 |
|
Briscoe County, Texas |
9.82 |
|
Fergus County, Montana |
9.8 |
|
Finney County, Kansas |
9.73 |
|
Iowa County, Wisconsin |
9.7 |
|
Langlade County, Wisconsin |
9.69 |
|
Murray County, Minnesota |
9.66 |
|
Barton County, Missouri |
9.55 |
|
Orleans County, Vermont |
9.55 |
|
Moca Municipio, Puerto Rico |
9.52 |
|
Pierce County, Nebraska |
9.51 |
|
Scott County, Arkansas |
9.49 |
|
Plymouth County, Iowa |
9.48 |
|
Lincoln County, Nebraska |
9.46 |
|
Greene County, Indiana |
9.44 |
|
Jackson County, Minnesota |
9.43 |
|
Valley County, Nebraska |
9.42 |
|
Gray County, Texas |
9.41 |
|
Humphreys County, Mississippi |
9.38 |
|
McCulloch County, Texas |
9.37 |
|
Trempealeau County, Wisconsin |
9.37 |
|
Mitchell County, Kansas |
9.33 |
|
Presidio County, Texas |
9.32 |
|
Ida County, Iowa |
9.3 |
|
Adams County, Pennsylvania |
9.3 |
|
Roberts County, South Dakota |
9.28 |
|
Carroll County, Arkansas |
9.25 |
|
Winona County, Minnesota |
9.25 |
|
Greene County, Alabama |
9.16 |
|
Fillmore County, Nebraska |
9.16 |
|
Orange County, Vermont |
9.07 |
|
Logan County, Colorado |
9.06 |
|
Floyd County, Iowa |
9.06 |
|
Burleson County, Texas |
9.06 |
|
Washington County, New York |
9.05 |
|
Cabo Rojo Municipio, Puerto Rico |
9.04 |
|
Kimble County, Texas |
9.02 |
|
La Salle County, Texas |
8.98 |
|
Platte County, Nebraska |
8.96 |
|
Nottoway County, Virginia |
8.93 |
|
Washington County, Illinois |
8.92 |
|
Huntingdon County, Pennsylvania |
8.91 |
|
Sunflower County, Mississippi |
8.89 |
|
Randolph County, Indiana |
8.88 |
|
Hopkins County, Texas |
8.87 |
|
Warren County, North Carolina |
8.83 |
|
Wayne County, North Carolina |
8.8 |
|
Clinch County, Georgia |
8.75 |
|
Pike County, Arkansas |
8.73 |
|
Sac County, Iowa |
8.68 |
|
Delta County, Colorado |
8.67 |
|
Fall River County, South Dakota |
8.67 |
|
Fulton County, Pennsylvania |
8.64 |
|
Frio County, Texas |
8.59 |
|
Grayson County, Virginia |
8.59 |
|
Barry County, Missouri |
8.58 |
|
Carroll County, Indiana |
8.52 |
|
Mercer County, Ohio |
8.51 |
|
Conway County, Arkansas |
8.42 |
|
Pershing County, Nevada |
8.41 |
|
Caldwell County, Texas |
8.39 |
|
Poweshiek County, Iowa |
8.36 |
|
Red River County, Texas |
8.34 |
|
Fond Du Lac County, Wisconsin |
8.33 |
|
Cherokee County, Iowa |
8.3 |
|
Stanley County, South Dakota |
8.3 |
|
Caswell County, North Carolina |
8.29 |
|
Monroe County, Kentucky |
8.28 |
|
Price County, Wisconsin |
8.28 |
|
Watonwan County, Minnesota |
8.26 |
|
Kingman County, Kansas |
8.18 |
|
Eastland County, Texas |
8.17 |
|
Newberry County, South Carolina |
8.12 |
|
Green County, Wisconsin |
8.12 |
|
Bennett County, South Dakota |
8.08 |
|
Waupaca County, Wisconsin |
8.08 |
|
Ford County, Kansas |
8.04 |
|
Wayne County, New York |
7.98 |
|
Republic County, Kansas |
7.97 |
|
Carroll County, Missouri |
7.97 |
|
Crook County, Wyoming |
7.97 |
|
Mitchell County, Georgia |
7.96 |
|
Yakima County, Washington |
7.91 |
|
Polk County, Wisconsin |
7.9 |
|
Crawford County, Ohio |
7.81 |
|
Washakie County, Wyoming |
7.8 |
|
Somerset County, Maryland |
7.74 |
|
Jones County, Iowa |
7.67 |
|
Muhlenberg County, Kentucky |
7.67 |
|
Huerfano County, Colorado |
7.66 |
|
Cass County, Iowa |
7.65 |
|
Johnson County, Wyoming |
7.65 |
|
Johnson County, Arkansas |
7.6 |
|
Park County, Wyoming |
7.57 |
|
Mason County, Washington |
7.55 |
|
Grimes County, Texas |
7.54 |
|
Clay County, Mississippi |
7.51 |
|
Fallon County, Montana |
7.43 |
|
Luna County, New Mexico |
7.43 |
|
Lee County, Georgia |
7.41 |
|
Lea County, New Mexico |
7.4 |
|
Nacogdoches County, Texas |
7.39 |
|
Dubois County, Indiana |
7.32 |
|
Van Wert County, Ohio |
7.32 |
|
Grant County, Washington |
7.31 |
|
Sheridan County, Wyoming |
7.31 |
|
Baker County, Oregon |
7.29 |
|
Fisher County, Texas |
7.28 |
|
Dodge County, Wisconsin |
7.27 |
|
Terry County, Texas |
7.26 |
|
Lynn County, Texas |
7.2 |
|
Valley County, Montana |
7.19 |
|
Hardin County, Ohio |
7.16 |
|
Anson County, North Carolina |
7.09 |
|
Rice County, Minnesota |
7.08 |
|
Pender County, North Carolina |
7.07 |
|
Haskell County, Oklahoma |
7 |
|
Dunn County, Wisconsin |
7 |
|
Pine County, Minnesota |
6.98 |
|
Coleman County, Texas |
6.94 |
|
Pondera County, Montana |
6.91 |
|
Elk County, Kansas |
6.9 |
|
Tuscola County, Michigan |
6.88 |
|
Ottawa County, Kansas |
6.87 |
|
Kershaw County, South Carolina |
6.87 |
|
Green Lake County, Wisconsin |
6.85 |
|
Madison County, Virginia |
6.84 |
|
Refugio County, Texas |
6.82 |
|
St. Lawrence County, New York |
6.81 |
|
Falls County, Texas |
6.79 |
|
Haskell County, Texas |
6.76 |
|
Arecibo Municipio, Puerto Rico |
6.76 |
|
Appling County, Georgia |
6.75 |
|
Lemhi County, Idaho |
6.74 |
|
Decatur County, Indiana |
6.74 |
|
San Augustine County, Texas |
6.69 |
|
Clinton County, New York |
6.68 |
|
Van Zandt County, Texas |
6.68 |
|
Goodhue County, Minnesota |
6.66 |
|
Clinton County, Indiana |
6.65 |
|
Washington County, Nebraska |
6.65 |
|
Marinette County, Wisconsin |
6.61 |
|
Kent County, Maryland |
6.57 |
|
Morton County, Kansas |
6.56 |
|
Jefferson County, Oregon |
6.54 |
|
Becker County, Minnesota |
6.52 |
|
Jefferson County, Wisconsin |
6.51 |
|
Red Willow County, Nebraska |
6.49 |
|
Gem County, Idaho |
6.48 |
|
Willacy County, Texas |
6.47 |
|
lsabela Municipio, Puerto Rico |
6.47 |
|
Sullivan County, New York |
6.45 |
|
Burke County, Georgia |
6.43 |
|
Pecos County, Texas |
6.4 |
|
DeSoto County, Florida |
6.38 |
|
Lander County, Nevada |
6.35 |
|
Weston County, Wyoming |
6.32 |
|
Del Norte County, California |
6.3 |
|
Lac Qui Parle County, Minnesota |
6.26 |
|
Butte County, South Dakota |
6.26 |
|
Hart County, Georgia |
6.25 |
|
Jones County, Texas |
6.24 |
|
Barron County, Wisconsin |
6.09 |
|
Rush County, Indiana |
6.05 |
|
Seward County, Kansas |
6.05 |
|
Caddo County, Oklahoma |
6.05 |
|
Lonoke County, Arkansas |
6.03 |
|
Montague County, Texas |
5.94 |
|
Mercer County, Illinois |
5.91 |
|
Yell County, Arkansas |
5.9 |
|
Crook County, Oregon |
5.88 |
|
Franklin County, New York |
5.87 |
|
Todd County, Kentucky |
5.84 |
|
Wells County, Indiana |
5.8 |
|
Otero County, Colorado |
5.79 |
|
Kosciusko County, Indiana |
5.79 |
|
Brewster County, Texas |
5.79 |
|
Hall County, Texas |
5.79 |
|
Morgan County, Georgia |
5.78 |
|
Benton County, Minnesota |
5.78 |
|
Freeborn County, Minnesota |
5.78 |
|
Callahan County, Texas |
5.78 |
|
Tioga County, New York |
5.75 |
|
Norton County, Kansas |
5.73 |
|
Marathon County, Wisconsin |
5.73 |
|
Richland County, Montana |
5.72 |
|
Gage County, Nebraska |
5.72 |
|
Marion County, Kansas |
5.69 |
|
Door County, Wisconsin |
5.67 |
|
Ozark County, Missouri |
5.66 |
|
Lavaca County, Texas |
5.65 |
|
Sheboygan County, Wisconsin |
5.64 |
|
Ashland County, Ohio |
5.62 |
|
Madison County, Missouri |
5.6 |
|
Santa Isabel Municipio, Puerto Rico |
5.58 |
|
Cass County, Michigan |
5.56 |
|
Stephens County, Texas |
5.54 |
|
Quay County, New Mexico |
5.53 |
|
Franklin County, Pennsylvania |
5.52 |
|
Pittsylvania County, Virginia |
5.52 |
|
Grundy County, Iowa |
5.5 |
|
Tehama County, California |
5.48 |
|
Pike County, Missouri |
5.47 |
|
Matagorda County, Texas |
5.47 |
|
Walworth County, South Dakota |
5.46 |
|
Butler County, Iowa |
5.44 |
|
Alexander County, North Carolina |
5.44 |
|
Brown County, Indiana |
5.42 |
|
Osage County, Kansas |
5.38 |
|
Jackson County, Wisconsin |
5.37 |
|
Stillwater County, Montana |
5.34 |
|
Mitchell County, Texas |
5.34 |
|
Dickinson County, Iowa |
5.33 |
|
Bee County, Texas |
5.33 |
|
Otter Tail County, Minnesota |
5.32 |
|
Audrain County, Missouri |
5.32 |
|
Franklin County, Virginia |
5.31 |
|
Miami County, Indiana |
5.29 |
|
Greene County, Iowa |
5.29 |
|
Wyandot County, Ohio |
5.29 |
|
Huntington County, Indiana |
5.26 |
|
Jim Wells County, Texas |
5.26 |
|
Cortland County, New York |
5.23 |
|
Lincoln County, New Mexico |
5.21 |
|
Madison County, New York |
5.2 |
|
Monroe County, Wisconsin |
5.16 |
|
Kiowa County, Oklahoma |
5.14 |
|
Cullman County, Alabama |
5.11 |
|
Jefferson County, New York |
5.11 |
|
Valencia County, New Mexico |
5.1 |
|
Barton County, Kansas |
5.09 |
|
Elko County, Nevada |
5.08 |
|
Fauquier County, Virginia |
5.07 |
|
Licking County, Ohio |
5.06 |
|
White Pine County, Nevada |
5.05 |
|
Whatcom County, Washington |
5.05 |
|
Beadle County, South Dakota |
5 |
|
Cheyenne County, Nebraska |
4.97 |
|
Mahaska County, Iowa |
4.96 |
|
Coke County, Texas |
4.96 |
|
Livingston County, Illinois |
4.93 |
|
Little River County, Arkansas |
4.88 |
|
Pottawatomie County, Kansas |
4.88 |
|
Reeves County, Texas |
4.85 |
|
Sauk County, Wisconsin |
4.85 |
|
Polk County, Arkansas |
4.83 |
|
Arenac County, Michigan |
4.83 |
|
DeWitt County, Texas |
4.83 |
|
Juneau County, Wisconsin |
4.82 |
|
Big Horn County, Wyoming |
4.81 |
|
Jefferson County, Washington |
4.79 |
|
Washburn County, Wisconsin |
4.75 |
|
Dickinson County, Kansas |
4.73 |
|
Hawaii County, Hawaii |
4.72 |
|
Noble County, Indiana |
4.72 |
|
Lake County, South Dakota |
4.69 |
|
Pratt County, Kansas |
4.67 |
|
Menominee County, Michigan |
4.67 |
|
Dukes County, Massachusetts |
4.66 |
|
Presque Isle County, Michigan |
4.65 |
|
Pendleton County, West Virginia |
4.64 |
|
Cleburne County, Arkansas |
4.62 |
|
Atascosa County, Texas |
4.62 |
|
Scotts Bluff County, Nebraska |
4.61 |
|
Dawson County, Texas |
4.58 |
|
Montrose County, Colorado |
4.56 |
|
Lamar County, Texas |
4.56 |
|
Morgan County, Missouri |
4.55 |
|
Delaware County, Iowa |
4.5 |
|
Vermillion County, Indiana |
4.47 |
|
Saline County, Missouri |
4.47 |
|
Las Piedras Municipio, Puerto Rico |
4.46 |
|
Walworth County, Wisconsin |
4.45 |
|
Runnels County, Texas |
4.44 |
|
Potter County, Pennsylvania |
4.4 |
|
Carroll County, Iowa |
4.37 |
|
Wayne County, Ohio |
4.37 |
|
Macoupin County, Illinois |
4.36 |
|
Thurston County, Nebraska |
4.36 |
|
Chesterfield County, South Carolina |
4.34 |
|
Branch County, Michigan |
4.33 |
|
Brule County, South Dakota |
4.33 |
|
Fulton County, Illinois |
4.31 |
|
Isabella County, Michigan |
4.3 |
|
Sherman County, Kansas |
4.29 |
|
Stanly County, North Carolina |
4.29 |
|
Marion County, Florida |
4.28 |
|
Moffat County, Colorado |
4.27 |
|
Gunnison County, Colorado |
4.26 |
|
Jackson County, Iowa |
4.26 |
|
Madison County, Ohio |
4.24 |
|
Rockingham County, Virginia |
4.24 |
|
Adams County, Idaho |
4.22 |
|
Mower County, Minnesota |
4.21 |
|
Linn County, Kansas |
4.2 |
|
Halifax County, North Carolina |
4.2 |
|
Bradford County, Florida |
4.19 |
|
Montgomery County, New York |
4.19 |
|
Perry County, Alabama |
4.18 |
|
Pierce County, Georgia |
4.17 |
|
Lenawee County, Michigan |
4.16 |
|
Klamath County, Oregon |
4.16 |
|
Jerauld County, South Dakota |
4.15 |
|
Wilson County, Texas |
4.15 |
|
Bond County, Illinois |
4.14 |
|
Stearns County, Minnesota |
4.14 |
|
Culberson County, Texas |
4.14 |
|
Martin County, Texas |
4.13 |
|
Ashland County, Wisconsin |
4.11 |
|
Sevier County, Utah |
4.09 |
|
Putnam County, Ohio |
4.08 |
|
Ceiba Municipio, Puerto Rico |
4.06 |
|
Idaho County, Idaho |
4.03 |
|
Dona Ana County, New Mexico |
4.02 |
|
Lyon County, Minnesota |
4 |
|
Madison County, Georgia |
3.99 |
|
Jackson County, Texas |
3.98 |
|
St. Croix County, Wisconsin |
3.95 |
|
Columbia County, Wisconsin |
3.93 |
|
Laclede County, Missouri |
3.92 |
|
Adams County, Indiana |
3.9 |
|
Umatilla County, Oregon |
3.9 |
|
Medina County, Texas |
3.87 |
|
Highlands County, Florida |
3.85 |
|
Neosho County, Kansas |
3.83 |
|
Carroll County, Illinois |
3.82 |
|
Skagit County, Washington |
3.8 |
|
Craig County, Oklahoma |
3.79 |
|
Island County, Washington |
3.77 |
|
Young County, Texas |
3.76 |
|
Humboldt County, California |
3.73 |
|
Wabaunsee County, Kansas |
3.73 |
|
Colorado County, Texas |
3.73 |
|
Washington County, Texas |
3.73 |
|
Todd County, South Dakota |
3.72 |
|
Woods County, Oklahoma |
3.71 |
|
Rockbridge County, Virginia |
3.71 |
|
Steuben County, New York |
3.68 |
|
Ottawa County, Michigan |
3.65 |
|
Fremont County, Iowa |
3.64 |
|
Jo Daviess County, Illinois |
3.63 |
|
Snyder County, Pennsylvania |
3.63 |
|
Winkler County, Texas |
3.62 |
|
Fayette County, Tennessee |
3.59 |
|
Allegany County, New York |
3.57 |
|
Richmond County, North Carolina |
3.57 |
|
Lincoln County, Missouri |
3.56 |
|
Lawrence County, Alabama |
3.55 |
|
Freestone County, Texas |
3.54 |
|
Shelby County, Illinois |
3.5 |
|
Williams County, Ohio |
3.49 |
|
Austin County, Texas |
3.48 |
|
Greenbrier County, West Virginia |
3.48 |
|
Lancaster County, Pennsylvania |
3.46 |
|
Montgomery County, Illinois |
3.44 |
|
Fresno County, California |
3.42 |
|
Harrisonburg City, Virginia |
3.42 |
|
Prince of Wales-Hyder Census Area, Alaska |
3.41 |
|
McDonough County, Illinois |
3.4 |
|
Miller County, Missouri |
3.4 |
|
Codington County, South Dakota |
3.4 |
|
Kerr County, Texas |
3.4 |
|
Blue Earth County, Minnesota |
3.37 |
|
McDuffie County, Georgia |
3.34 |
|
Duval County, Texas |
3.33 |
|
Wood County, Texas |
3.33 |
|
Juncos Municipio, Puerto Rico |
3.33 |
|
Alfalfa County, Oklahoma |
3.31 |
|
Anderson County, Texas |
3.31 |
|
DeKalb County, Illinois |
3.29 |
|
Logan County, Illinois |
3.27 |
|
Ontario County, New York |
3.27 |
|
Wayne County, Indiana |
3.26 |
|
Scurry County, Texas |
3.24 |
|
Somerset County, Maine |
3.22 |
|
Scott County, Kentucky |
3.2 |
|
Kern County, California |
3.19 |
|
Putnam County, Missouri |
3.19 |
|
Clinton County, Pennsylvania |
3.19 |
|
Caroline County, Maryland |
3.17 |
|
Otoe County, Nebraska |
3.17 |
|
Lewis County, Washington |
3.16 |
|
Hamilton County, Nebraska |
3.14 |
|
Adams County, Nebraska |
3.1 |
|
Laramie County, Wyoming |
3.1 |
|
Callaway County, Missouri |
3.09 |
|
Iredell County, North Carolina |
3.09 |
|
Morris County, Texas |
3.09 |
|
Henry County, Iowa |
3.08 |
|
Cattaraugus County, New York |
3.08 |
|
Rains County, Texas |
3.07 |
|
Le Flore County, Oklahoma |
3.06 |
|
Cache County, Utah |
3.06 |
|
Naranjito Municipio, Puerto Rico |
3.06 |
|
DeKalb County, Alabama |
3.05 |
|
Orange County, Virginia |
3.05 |
|
Delaware County, New York |
3.04 |
|
Okanogan County, Washington |
3.04 |
|
Webster County, Missouri |
3.03 |
|
Mason County, Michigan |
3.02 |
|
Crawford County, Pennsylvania |
3.02 |
|
Wright County, Missouri |
3.01 |
|
Grand County, Colorado |
3 |
|
Sullivan County, New Hampshire |
3 |
|
Sawyer County, Wisconsin |
3 |
|
Wythe County, Virginia |
2.98 |
|
Louisa County, Iowa |
2.97 |
|
Lee County, Texas |
2.97 |
|
Rio Grande County, Colorado |
2.96 |
|
Lincoln County, Maine |
2.96 |
|
Chippewa County, Wisconsin |
2.96 |
|
McLean County, North Dakota |
2.94 |
|
McClain County, Oklahoma |
2.92 |
|
Dallas County, Iowa |
2.91 |
|
Schoharie County, New York |
2.91 |
|
Bradford County, Pennsylvania |
2.91 |
|
Maverick County, Texas |
2.88 |
|
Androscoggin County, Maine |
2.86 |
|
Dillon County, South Carolina |
2.85 |
|
Parker County, Texas |
2.85 |
|
Park County, Colorado |
2.84 |
|
McLeod County, Minnesota |
2.84 |
|
San Miguel County, New Mexico |
2.84 |
|
Holmes County, Ohio |
2.84 |
|
Osage County, Oklahoma |
2.84 |
|
Augusta County, Virginia |
2.84 |
|
Ogle County, Illinois |
2.83 |
|
Le Sueur County, Minnesota |
2.83 |
|
Oregon County, Missouri |
2.83 |
|
Edgecombe County, North Carolina |
2.83 |
|
Tioga County, Pennsylvania |
2.82 |
|
Windsor County, Vermont |
2.82 |
|
Pitkin County, Colorado |
2.81 |
|
Wright County, Minnesota |
2.81 |
|
Marion County, Ohio |
2.79 |
|
Iron County, Utah |
2.78 |
|
Greene County, Virginia |
2.77 |
|
Hardy County, West Virginia |
2.77 |
|
Beaufort County, North Carolina |
2.76 |
|
Tom Green County, Texas |
2.75 |
|
Pulaski County, Virginia |
2.75 |
|
Elbert County, Colorado |
2.74 |
|
Routt County, Colorado |
2.72 |
|
Karnes County, Texas |
2.72 |
|
Cooke County, Texas |
2.71 |
|
Gillespie County, Texas |
2.71 |
|
Logan County, Ohio |
2.7 |
|
Thurston County, Washington |
2.7 |
|
Spencer County, Indiana |
2.67 |
|
Henderson County, Texas |
2.67 |
|
Butler County, Kansas |
2.66 |
|
Woodward County, Oklahoma |
2.66 |
|
Blount County, Alabama |
2.65 |
|
Benton County, Arkansas |
2.65 |
|
Henry County, Indiana |
2.65 |
|
Ste. Genevieve County, Missouri |
2.63 |
|
Stutsman County, North Dakota |
2.63 |
|
Coryell County, Texas |
2.63 |
|
Alleghany County, North Carolina |
2.61 |
|
Wilkes County, North Carolina |
2.61 |
|
Jones County, Mississippi |
2.6 |
|
Chenango County, New York |
2.6 |
|
Bates County, Missouri |
2.59 |
|
Johnston County, Oklahoma |
2.59 |
|
Knox County, Illinois |
2.56 |
|
Upshur County, Texas |
2.56 |
|
Greene County, Arkansas |
2.55 |
|
Morton County, North Dakota |
2.55 |
|
Yamhill County, Oregon |
2.55 |
|
Cass County, Indiana |
2.54 |
|
Ravalli County, Montana |
2.54 |
|
Carson County, Texas |
2.54 |
|
Buffalo County, Nebraska |
2.53 |
|
Northumberland County, Pennsylvania |
2.53 |
|
Hoke County, North Carolina |
2.52 |
|
Brown County, Wisconsin |
2.52 |
|
Lebanon County, Pennsylvania |
2.51 |
|
Brazos County, Texas |
2.49 |
|
Hill County, Texas |
2.49 |
|
Lincoln County, Wyoming |
2.49 |
|
Garvin County, Oklahoma |
2.48 |
|
Surry County, North Carolina |
2.47 |
|
Wayne County, Georgia |
2.46 |
|
Lagrange County, Indiana |
2.46 |
|
Rio Grande Municipio, Puerto Rico |
2.46 |
|
Wilkes County, Georgia |
2.44 |
|
White County, Arkansas |
2.43 |
|
Coos County, Oregon |
2.43 |
|
Rensselaer County, New York |
2.42 |
|
Washington County, Virginia |
2.42 |
|
Blaine County, Idaho |
2.4 |
|
Blair County, Pennsylvania |
2.4 |
|
Hutchinson County, Texas |
2.4 |
|
Rock County, Wisconsin |
2.39 |
|
Sumter County, Alabama |
2.37 |
|
Sonoma County, California |
2.37 |
|
Redwood County, Minnesota |
2.37 |
|
Glacier County, Montana |
2.37 |
|
Shenandoah County, Virginia |
2.37 |
|
Polk County, Minnesota |
2.36 |
|
Eddy County, New Mexico |
2.36 |
|
Union County, North Carolina |
2.35 |
|
Oldham County, Kentucky |
2.34 |
|
Lenoir County, North Carolina |
2.34 |
|
Nolan County, Texas |
2.34 |
|
Bedford County, Pennsylvania |
2.33 |
|
Somerset County, Pennsylvania |
2.33 |
|
Lincoln County, Wisconsin |
2.33 |
|
Jack County, Texas |
2.32 |
|
Sullivan County, Missouri |
2.31 |
|
Washington County, Wisconsin |
2.31 |
|
Wood County, Wisconsin |
2.31 |
|
Rincon Municipio, Puerto Rico |
2.31 |
|
Marshall County, Indiana |
2.29 |
|
Waldo County, Maine |
2.26 |
|
Hughes County, South Dakota |
2.26 |
|
Goochland County, Virginia |
2.26 |
|
Outagamie County, Wisconsin |
2.26 |
|
Accomack County, Virginia |
2.25 |
|
Trinity County, California |
2.23 |
|
Brown County, South Dakota |
2.23 |
|
Culpeper County, Virginia |
2.22 |
|
San German Municipio, Puerto Rico |
2.22 |
|
Unknown Or Undefined, Idaho |
2.21 |
|
Grundy County, Missouri |
2.2 |
|
Cheshire County, New Hampshire |
2.19 |
|
Shiawassee County, Michigan |
2.17 |
|
Campbell County, Virginia |
2.17 |
|
New London County, Connecticut |
2.16 |
|
Hopkins County, Kentucky |
2.16 |
|
Yoakum County, Texas |
2.16 |
|
Mecosta County, Michigan |
2.15 |
|
Gallatin County, Montana |
2.15 |
|
Pickaway County, Ohio |
2.15 |
|
Crawford County, Wisconsin |
2.15 |
|
Concordia Parish, Louisiana |
2.14 |
|
Chautauqua County, New York |
2.14 |
|
Jessamine County, Kentucky |
2.13 |
|
Franklin County, Kansas |
2.12 |
|
Bastrop County, Texas |
2.12 |
|
Hockley County, Texas |
2.12 |
|
Tate County, Mississippi |
2.11 |
|
Fentress County, Tennessee |
2.11 |
|
Montgomery County, Kansas |
2.09 |
|
Fremont County, Wyoming |
2.09 |
|
Bremer County, Iowa |
2.08 |
|
Houston County, Texas |
2.08 |
|
Portage County, Wisconsin |
2.07 |
|
Ray County, Missouri |
2.05 |
|
Frederick County, Maryland |
2.04 |
|
Marshall County, Alabama |
2.03 |
|
Jackson County, Georgia |
2.02 |
|
Evans County, Georgia |
2.01 |
|
Labette County, Kansas |
2.01 |
|
Union County, Ohio |
2.01 |
|
Fannin County, Texas |
2.01 |
|
Randall County, Texas |
2.01 |
|
Lewis and Clark County, Montana |
2 |
|
Madison County, Nebraska |
2 |
|
De Soto Parish, Louisiana |
1.97 |
|
Noxubee County, Mississippi |
1.97 |
|
Orangeburg County, South Carolina |
1.97 |
|
Washington County, Indiana |
1.96 |
|
Kendall County, Texas |
1.96 |
|
Brown County, Texas |
1.93 |
|
Carter County, Oklahoma |
1.92 |
|
Windham County, Vermont |
1.92 |
|
Lincoln County, Tennessee |
1.91 |
|
Tolland County, Connecticut |
1.9 |
|
Benton County, Missouri |
1.9 |
|
Val Verde County, Texas |
1.9 |
|
Henry County, Kentucky |
1.88 |
|
Vernon County, Missouri |
1.88 |
|
Coos County, New Hampshire |
1.88 |
|
Manati Municipio, Puerto Rico |
1.88 |
|
Cedar County, Missouri |
1.87 |
|
Pettis County, Missouri |
1.87 |
|
Thomas County, Georgia |
1.86 |
|
DeKalb County, Indiana |
1.86 |
|
Hood County, Texas |
1.86 |
|
Yadkin County, North Carolina |
1.85 |
|
Marshall County, Iowa |
1.84 |
|
Kittitas County, Washington |
1.84 |
|
Jackson County, Florida |
1.83 |
|
Jefferson County, Kansas |
1.82 |
|
Fayette County, Kentucky |
1.82 |
|
Tompkins County, New York |
1.82 |
|
Page County, Virginia |
1.82 |
|
Effingham County, Illinois |
1.81 |
|
Tuscarawas County, Ohio |
1.81 |
|
Toa Alta Municipio, Puerto Rico |
1.81 |
|
Yuma County, Arizona |
1.8 |
|
Calhoun County, Texas |
1.8 |
|
Ohio County, Kentucky |
1.79 |
|
Pitt County, North Carolina |
1.79 |
|
Nelson County, Virginia |
1.79 |
|
Grays Harbor County, Washington |
1.79 |
|
Clinton County, Iowa |
1.78 |
|
Palo Pinto County, Texas |
1.77 |
|
Lake County, Montana |
1.74 |
|
Dallas County, Alabama |
1.72 |
|
Mille Lacs County, Minnesota |
1.72 |
|
Polk County, Missouri |
1.72 |
|
Waller County, Texas |
1.72 |
|
Harvey County, Kansas |
1.71 |
|
Boone County, Indiana |
1.7 |
|
Jasper County, Missouri |
1.7 |
|
Herkimer County, New York |
1.7 |
|
Champaign County, Ohio |
1.7 |
|
Coshocton County, Ohio |
1.7 |
|
Cidra Municipio, Puerto Rico |
1.7 |
|
Santa Cruz County, Arizona |
1.69 |
|
Franklin County, North Carolina |
1.69 |
|
Knox County, Ohio |
1.69 |
|
Madison County, Texas |
1.68 |
|
Windham County, Connecticut |
1.67 |
|
Henry County, Missouri |
1.67 |
|
Mariposa County, California |
1.66 |
|
Woodbury County, Iowa |
1.66 |
|
Lyon County, Kansas |
1.66 |
|
Potter County, Texas |
1.65 |
|
Cooper County, Missouri |
1.64 |
|
Caledonia County, Vermont |
1.64 |
|
Walla Walla County, Washington |
1.64 |
|
Queen Anne's County, Maryland |
1.63 |
|
Cherokee County, Texas |
1.63 |
|
Winnebago County, Wisconsin |
1.63 |
|
Dodge County, Nebraska |
1.62 |
|
Cochise County, Arizona |
1.6 |
|
Seneca County, New York |
1.6 |
|
Nassau County, Florida |
1.58 |
|
Fulton County, Indiana |
1.58 |
|
Botetourt County, Virginia |
1.57 |
|
Washington County, Arkansas |
1.56 |
|
Berks County, Pennsylvania |
1.56 |
|
Russell County, Virginia |
1.56 |
|
Franklin County, Indiana |
1.55 |
|
Grafton County, New Hampshire |
1.55 |
|
Marshall County, Kansas |
1.54 |
|
Uintah County, Utah |
1.54 |
|
Calhoun County, Michigan |
1.52 |
|
Hampshire County, West Virginia |
1.51 |
|
Ozaukee County, Wisconsin |
1.5 |
|
Sumter County, Florida |
1.49 |
|
Dane County, Wisconsin |
1.49 |
|
Niagara County, New York |
1.48 |
|
Villalba Municipio, Puerto Rico |
1.46 |
|
Vermilion Parish, Louisiana |
1.45 |
|
Randolph County, North Carolina |
1.45 |
|
Robeson County, North Carolina |
1.45 |
|
Union County, Oregon |
1.45 |
|
Titus County, Texas |
1.45 |
|
Wilson County, Kansas |
1.44 |
|
Garfield County, Oklahoma |
1.44 |
|
Steuben County, Indiana |
1.43 |
|
Warren County, Iowa |
1.43 |
|
Polk County, North Carolina |
1.43 |
|
Crawford County, Missouri |
1.42 |
|
Whitman County, Washington |
1.42 |
|
Garfield County, Colorado |
1.41 |
|
Kauai County, Hawaii |
1.41 |
|
Mcpherson County, Kansas |
1.41 |
|
Hubbard County, Minnesota |
1.41 |
|
Franklin County, Missouri |
1.41 |
|
Union County, South Dakota |
1.41 |
|
Asotin County, Washington |
1.41 |
|
Lares Municipio, Puerto Rico |
1.41 |
|
Wadena County, Minnesota |
1.4 |
|
Rutland County, Vermont |
1.4 |
|
Yavapai County, Arizona |
1.39 |
|
Fremont County, Colorado |
1.37 |
|
Shelby County, Ohio |
1.37 |
|
LaPorte County, Indiana |
1.36 |
|
Grant County, New Mexico |
1.36 |
|
Liberty County, Texas |
1.36 |
|
Ulster County, New York |
1.35 |
|
Beckham County, Oklahoma |
1.35 |
|
Clatsop County, Oregon |
1.34 |
|
Randolph County, Missouri |
1.33 |
|
Johnston County, North Carolina |
1.33 |
|
Kennebec County, Maine |
1.32 |
|
Camden County, Missouri |
1.32 |
|
Saratoga County, New York |
1.32 |
|
Bedford County, Tennessee |
1.31 |
|
Shelby County, Indiana |
1.29 |
|
Warren County, Pennsylvania |
1.29 |
|
Teton County, Wyoming |
1.29 |
|
Warren County, New Jersey |
1.28 |
|
Perry County, Indiana |
1.27 |
|
Sullivan County, Indiana |
1.27 |
|
Marion County, Oregon |
1.27 |
|
Albemarle County, Virginia |
1.27 |
|
Las Animas County, Colorado |
1.26 |
|
Newton County, Missouri |
1.26 |
|
Uinta County, Wyoming |
1.26 |
|
Hall County, Georgia |
1.25 |
|
Franklin County, Massachusetts |
1.24 |
|
Douglas County, Nevada |
1.23 |
|
Inyo County, California |
1.22 |
|
Mercer County, Kentucky |
1.21 |
|
Lamoille County, Vermont |
1.21 |
|
Mineral County, West Virginia |
1.21 |
|
Carroll County, Maryland |
1.19 |
|
Rio Arriba County, New Mexico |
1.18 |
|
Clarion County, Pennsylvania |
1.18 |
|
Daviess County, Indiana |
1.17 |
|
Natrona County, Wyoming |
1.17 |
|
San Luis Obispo County, California |
1.16 |
|
Otsego County, New York |
1.16 |
|
Burnet County, Texas |
1.16 |
|
Jasper County, Texas |
1.16 |
|
Talladega County, Alabama |
1.15 |
|
Pasco County, Florida |
1.14 |
|
Schuylkill County, Pennsylvania |
1.14 |
|
Clay County, Minnesota |
1.13 |
|
Otero County, New Mexico |
1.13 |
|
Clackamas County, Oregon |
1.13 |
|
Victoria County, Texas |
1.13 |
|
Gibson County, Indiana |
1.12 |
|
Albany County, Wyoming |
1.12 |
|
Meade County, South Dakota |
1.11 |
|
Harnett County, North Carolina |
1.1 |
|
Auglaize County, Ohio |
1.1 |
|
Mifflin County, Pennsylvania |
1.1 |
|
Logan County, Arkansas |
1.09 |
|
Litchfield County, Connecticut |
1.09 |
|
Cass County, Missouri |
1.09 |
|
Washington County, Ohio |
1.09 |
|
Wood County, Ohio |
1.09 |
|
Utah County, Utah |
1.09 |
|
Hancock County, Maine |
1.08 |
|
Aguadilla Municipio, Puerto Rico |
1.08 |
|
Martin County, Florida |
1.07 |
|
Montgomery County, North Carolina |
1.07 |
|
Delaware County, Oklahoma |
1.07 |
|
Wasco County, Oregon |
1.07 |
|
San Juan County, Utah |
1.07 |
|
Armstrong County, Pennsylvania |
1.06 |
|
Washington County, Vermont |
1.05 |
|
Baldwin County, Alabama |
1.04 |
|
Mendocino County, California |
1.04 |
|
Salem County, New Jersey |
1.04 |
|
Randolph County, Arkansas |
1.03 |
|
Lincoln County, South Dakota |
1.03 |
|
Clarendon County, South Carolina |
1.02 |
|
Adams County, Illinois |
1.01 |
|
Penobscot County, Maine |
1.01 |
|
Cascade County, Montana |
1.01 |
|
Yellowstone County, Montana |
1.01 |
|
Canadian County, Oklahoma |
1.01 |
|
Indian River County, Florida |
1 |
|
Archuleta County, Colorado |
0.99 |
|
Marion County, Mississippi |
0.99 |
|
Chambers County, Texas |
0.99 |
|
Bedford County, Virginia |
0.99 |
|
Osceola County, Florida |
0.98 |
|
Morgan County, Indiana |
0.98 |
|
Seminole County, Oklahoma |
0.98 |
|
Mercer County, Pennsylvania |
0.98 |
|
McMinn County, Tennessee |
0.98 |
|
Montgomery County, Missouri |
0.97 |
|
Union County, Pennsylvania |
0.97 |
|
Larimer County, Colorado |
0.96 |
|
Lincoln County, North Carolina |
0.96 |
|
Humacao Municipio, Puerto Rico |
0.96 |
|
Vega Alta Municipio, Puerto Rico |
0.96 |
|
Ada County, Idaho |
0.95 |
|
Nodaway County, Missouri |
0.93 |
|
Webb County, Texas |
0.93 |
|
Pend Oreille County, Washington |
0.93 |
|
Sussex County, Delaware |
0.92 |
|
Muscatine County, Iowa |
0.92 |
|
Olmsted County, Minnesota |
0.92 |
|
Osage County, Missouri |
0.92 |
|
Onondaga County, New York |
0.92 |
|
Navarro County, Texas |
0.92 |
|
Putnam County, Florida |
0.91 |
|
Columbiana County, Ohio |
0.91 |
|
Barren County, Kentucky |
0.9 |
|
Lawrence County, South Dakota |
0.9 |
|
Angelina County, Texas |
0.89 |
|
Johnson County, Texas |
0.89 |
|
Limestone County, Texas |
0.89 |
|
Marshall County, Kentucky |
0.88 |
|
Susquehanna County, Pennsylvania |
0.88 |
|
Pottawattamie County, Iowa |
0.87 |
|
Logan County, Kentucky |
0.87 |
|
Franklin County, Maine |
0.87 |
|
Hall County, Nebraska |
0.86 |
|
Taylor County, Texas |
0.86 |
|
Atoka County, Oklahoma |
0.85 |
|
Hunt County, Texas |
0.85 |
|
Jasper County, Iowa |
0.84 |
|
Clallam County, Washington |
0.84 |
|
Bannock County, Idaho |
0.83 |
|
Hancock County, Indiana |
0.83 |
|
Dubuque County, Iowa |
0.83 |
|
Logan County, Oklahoma |
0.83 |
|
Lowndes County, Mississippi |
0.82 |
|
Jefferson County, West Virginia |
0.82 |
|
Montgomery County, Indiana |
0.81 |
|
La Plata County, Colorado |
0.8 |
|
Midland County, Texas |
0.8 |
|
Steele County, Minnesota |
0.79 |
|
Cowley County, Kansas |
0.78 |
|
Ellis County, Kansas |
0.78 |
|
Unknown Or Undefined, Michigan |
0.78 |
|
Douglas County, Minnesota |
0.78 |
|
Bennington County, Vermont |
0.78 |
|
Reno County, Kansas |
0.77 |
|
Bullock County, Alabama |
0.76 |
|
Bonner County, Idaho |
0.76 |
|
Kaufman County, Texas |
0.76 |
|
Calhoun County, Alabama |
0.75 |
|
Haywood County, North Carolina |
0.75 |
|
Lubbock County, Texas |
0.75 |
|
Mason County, Kentucky |
0.74 |
|
Clark County, Ohio |
0.74 |
|
Unknown Or Undefined, Oklahoma |
0.74 |
|
Obion County, Tennessee |
0.74 |
|
Wise County, Texas |
0.74 |
|
Carver County, Minnesota |
0.73 |
|
Flathead County, Montana |
0.73 |
|
Oneida County, New York |
0.73 |
|
Custer County, Oklahoma |
0.73 |
|
Mesa County, Colorado |
0.71 |
|
Madison County, Idaho |
0.71 |
|
Pearl River County, Mississippi |
0.71 |
|
Guadalupe County, Texas |
0.71 |
|
Oconee County, South Carolina |
0.7 |
|
Yolo County, California |
0.69 |
|
San Juan County, Washington |
0.69 |
|
Lapeer County, Michigan |
0.68 |
|
Craven County, North Carolina |
0.68 |
|
Allen County, Ohio |
0.68 |
|
Bryan County, Oklahoma |
0.68 |
|
Marin County, California |
0.67 |
|
Howard County, Indiana |
0.67 |
|
Vega Baja Municipio, Puerto Rico |
0.67 |
|
Walker County, Georgia |
0.66 |
|
Berkshire County, Massachusetts |
0.66 |
|
Fajardo Municipio, Puerto Rico |
0.66 |
|
Brunswick County, North Carolina |
0.64 |
|
Ouachita Parish, Louisiana |
0.63 |
|
Manatee County, Florida |
0.62 |
|
Stark County, Ohio |
0.62 |
|
Columbia County, Pennsylvania |
0.62 |
|
Maui + Kalawao County, Hawaii |
0.61 |
|
Kalamazoo County, Michigan |
0.61 |
|
Newport County, Rhode Island |
0.61 |
|
San Bernardino County, California |
0.6 |
|
Hampshire County, Massachusetts |
0.6 |
|
Ashtabula County, Ohio |
0.6 |
|
Howard County, Texas |
0.6 |
|
Preston County, West Virginia |
0.6 |
|
Maricopa County, Arizona |
0.59 |
|
Elkhart County, Indiana |
0.59 |
|
Douglas County, Oregon |
0.59 |
|
Washington County, Utah |
0.59 |
|
Muskegon County, Michigan |
0.58 |
|
Jackson County, Oregon |
0.58 |
|
Cumberland County, Pennsylvania |
0.58 |
|
Lee County, Iowa |
0.57 |
|
Dutchess County, New York |
0.57 |
|
Washington County, Oklahoma |
0.57 |
|
Bell County, Texas |
0.57 |
|
Eau Claire County, Wisconsin |
0.57 |
|
Kankakee County, Illinois |
0.56 |
|
Cape Girardeau County, Missouri |
0.56 |
|
Geauga County, Ohio |
0.56 |
|
Black Hawk County, Iowa |
0.55 |
|
Person County, North Carolina |
0.55 |
|
Josephine County, Oregon |
0.55 |
|
Coconino County, Arizona |
0.54 |
|
Monterey County, California |
0.54 |
|
Riverside County, California |
0.54 |
|
Polk County, Florida |
0.54 |
|
Robertson County, Tennessee |
0.53 |
|
Bowie County, Texas |
0.53 |
|
Pierce County, Washington |
0.53 |
|
Escambia County, Alabama |
0.52 |
|
Santa Barbara County, California |
0.52 |
|
Crow Wing County, Minnesota |
0.52 |
|
Hinds County, Mississippi |
0.52 |
|
Colleton County, South Carolina |
0.52 |
|
Rusk County, Texas |
0.52 |
|
Minnehaha County, South Dakota |
0.51 |
|
Zapata County, Texas |
0.51 |
|
Sedgwick County, Kansas |
0.5 |
|
Henderson County, North Carolina |
0.5 |
|
Summit County, Utah |
0.5 |
|
Scott County, Iowa |
0.49 |
|
Acadia Parish, Louisiana |
0.49 |
|
Lincoln Parish, Louisiana |
0.49 |
|
Nelson County, Kentucky |
0.48 |
|
Chester County, Pennsylvania |
0.48 |
|
McLennan County, Texas |
0.48 |
|
Racine County, Wisconsin |
0.48 |
|
Morgan County, Alabama |
0.47 |
|
Broome County, New York |
0.47 |
|
Mahoning County, Ohio |
0.47 |
|
Medina County, Ohio |
0.47 |
|
Westmoreland County, Pennsylvania |
0.47 |
|
Washington County, Rhode Island |
0.47 |
|
Alachua County, Florida |
0.46 |
|
Hancock County, Ohio |
0.46 |
|
Weber County, Utah |
0.46 |
|
Gila County, Arizona |
0.45 |
|
Macon County, North Carolina |
0.45 |
|
Onslow County, North Carolina |
0.45 |
|
Greene County, Ohio |
0.45 |
|
Smith County, Texas |
0.45 |
|
Oconee County, Georgia |
0.44 |
|
Saginaw County, Michigan |
0.44 |
|
Snohomish County, Washington |
0.44 |
|
Caguas Municipio, Puerto Rico |
0.44 |
|
Coffee County, Alabama |
0.43 |
|
Walton County, Georgia |
0.43 |
|
Barnstable County, Massachusetts |
0.43 |
|
Grayson County, Texas |
0.43 |
|
La Crosse County, Wisconsin |
0.43 |
|
Tazewell County, Illinois |
0.42 |
|
Hays County, Texas |
0.42 |
|
Miller County, Arkansas |
0.41 |
|
Warren County, Kentucky |
0.41 |
|
Ingham County, Michigan |
0.41 |
|
Hillsborough County, Florida |
0.4 |
|
Johnson County, Iowa |
0.4 |
|
Clark County, Washington |
0.4 |
|
Tangipahoa Parish, Louisiana |
0.39 |
|
Wapello County, Iowa |
0.38 |
|
Livingston County, Michigan |
0.38 |
|
Jefferson County, Arkansas |
0.37 |
|
Cowlitz County, Washington |
0.37 |
|
Wilson County, North Carolina |
0.36 |
|
Pottawatomie County, Oklahoma |
0.36 |
|
Lake County, California |
0.35 |
|
Saline County, Kansas |
0.35 |
|
Erie County, New York |
0.35 |
|
Kenosha County, Wisconsin |
0.35 |
|
Bradley County, Tennessee |
0.34 |
|
Denton County, Texas |
0.34 |
|
Fort Bend County, Texas |
0.34 |
|
Boulder County, Colorado |
0.33 |
|
Unknown Or Undefined, Kentucky |
0.33 |
|
Howell County, Missouri |
0.33 |
|
Sussex County, New Jersey |
0.33 |
|
Lehigh County, Pennsylvania |
0.33 |
|
Bartow County, Georgia |
0.32 |
|
Lafourche Parish, Louisiana |
0.32 |
|
Granville County, North Carolina |
0.32 |
|
Madison County, Alabama |
0.31 |
|
Apache County, Arizona |
0.31 |
|
Nevada County, California |
0.31 |
|
San Diego County, California |
0.31 |
|
Kent County, Michigan |
0.31 |
|
Northampton County, Pennsylvania |
0.31 |
|
Orange County, Texas |
0.31 |
|
Chittenden County, Vermont |
0.31 |
|
Madison County, Kentucky |
0.3 |
|
Ellis County, Texas |
0.3 |
|
Nueces County, Texas |
0.3 |
|
Charlotte County, Florida |
0.29 |
|
Missoula County, Montana |
0.29 |
|
Lorain County, Ohio |
0.29 |
|
Blount County, Tennessee |
0.29 |
|
Loudoun County, Virginia |
0.29 |
|
Scott County, Minnesota |
0.28 |
|
Cambria County, Pennsylvania |
0.28 |
|
Ector County, Texas |
0.28 |
|
Rockwall County, Texas |
0.28 |
|
Essex County, Massachusetts |
0.27 |
|
Alamance County, North Carolina |
0.27 |
|
Dauphin County, Pennsylvania |
0.27 |
|
Lawrence County, Pennsylvania |
0.27 |
|
Marion County, Iowa |
0.26 |
|
Talbot County, Maryland |
0.26 |
|
Taos County, New Mexico |
0.26 |
|
Albany County, New York |
0.26 |
|
Chemung County, New York |
0.26 |
|
Cumberland County, North Carolina |
0.26 |
|
Belmont County, Ohio |
0.26 |
|
Warren County, Ohio |
0.26 |
|
Hidalgo County, Texas |
0.26 |
|
Coweta County, Georgia |
0.25 |
|
Washington County, Maryland |
0.25 |
|
Maury County, Tennessee |
0.25 |
|
Santa Cruz County, California |
0.24 |
|
Ventura County, California |
0.24 |
|
Citrus County, Florida |
0.24 |
|
Lake County, Florida |
0.24 |
|
Jackson County, Michigan |
0.24 |
|
Monroe County, Michigan |
0.24 |
|
Dakota County, Minnesota |
0.24 |
|
Orange County, North Carolina |
0.24 |
|
Pittsburg County, Oklahoma |
0.24 |
|
Pueblo County, Colorado |
0.23 |
|
Clay County, Florida |
0.23 |
|
Cleveland County, North Carolina |
0.23 |
|
Worcester County, Massachusetts |
0.22 |
|
Unknown Or Undefined, Missouri |
0.22 |
|
Williamson County, Tennessee |
0.22 |
|
Brazoria County, Texas |
0.22 |
|
Eagle County, Colorado |
0.21 |
|
El Paso County, Colorado |
0.21 |
|
Davidson County, North Carolina |
0.21 |
|
Wake County, North Carolina |
0.21 |
|
Trumbull County, Ohio |
0.21 |
|
Monroe County, Pennsylvania |
0.21 |
|
Fairfield County, Connecticut |
0.2 |
|
Stark County, North Dakota |
0.2 |
|
Cameron County, Texas |
0.2 |
|
Plymouth County, Massachusetts |
0.19 |
|
Hunterdon County, New Jersey |
0.19 |
|
Wayne County, Pennsylvania |
0.19 |
|
Comal County, Texas |
0.19 |
|
Hanover County, Virginia |
0.19 |
|
Madison County, Illinois |
0.18 |
|
Rankin County, Mississippi |
0.18 |
|
San Juan Municipio, Puerto Rico |
0.18 |
|
Sarasota County, Florida |
0.17 |
|
Anoka County, Minnesota |
0.17 |
|
St. Charles County, Missouri |
0.17 |
|
Erie County, Pennsylvania |
0.17 |
|
Jefferson County, Texas |
0.17 |
|
Tarrant County, Texas |
0.17 |
|
Kitsap County, Washington |
0.17 |
|
Pima County, Arizona |
0.16 |
|
Collier County, Florida |
0.16 |
|
Lee County, Florida |
0.16 |
|
Honolulu County, Hawaii |
0.16 |
|
Burleigh County, North Dakota |
0.16 |
|
Washington County, Pennsylvania |
0.16 |
|
Montgomery County, Alabama |
0.15 |
|
El Dorado County, California |
0.15 |
|
Palm Beach County, Florida |
0.15 |
|
Volusia County, Florida |
0.15 |
|
Unknown Or Undefined, Illinois |
0.15 |
|
Unknown Or Undefined, Minnesota |
0.15 |
|
Monmouth County, New Jersey |
0.15 |
|
Erie County, Ohio |
0.15 |
|
Spokane County, Washington |
0.15 |
|
St. Croix, Virgin Islands |
0.15 |
|
Floyd County, Georgia |
0.14 |
|
Rock Island County, Illinois |
0.14 |
|
Genesee County, Michigan |
0.14 |
|
Butler County, Pennsylvania |
0.14 |
|
Collin County, Texas |
0.14 |
|
Williamson County, Texas |
0.14 |
|
Houston County, Georgia |
0.13 |
|
Riley County, Kansas |
0.13 |
|
Guilford County, North Carolina |
0.13 |
|
Delaware County, Ohio |
0.13 |
|
Bucks County, Pennsylvania |
0.13 |
|
Montgomery County, Texas |
0.13 |
|
Matanuska-Susitna Borough, Alaska |
0.12 |
|
Alameda County, California |
0.12 |
|
Unknown Or Undefined, Florida |
0.12 |
|
Bexar County, Texas |
0.12 |
|
Kane County, Illinois |
0.11 |
|
Monroe County, New York |
0.11 |
|
Montgomery County, Pennsylvania |
0.11 |
|
Gregg County, Texas |
0.11 |
|
Unknown Or Undefined, Texas |
0.11 |
|
Clay County, Missouri |
0.1 |
|
Providence County, Rhode Island |
0.1 |
|
Pennington County, South Dakota |
0.1 |
|
Galveston County, Texas |
0.1 |
|
Harris County, Texas |
0.1 |
|
Travis County, Texas |
0.1 |
|
Waukesha County, Wisconsin |
0.1 |
|
Lake County, Illinois |
0.09 |
|
Washtenaw County, Michigan |
0.09 |
|
Rockingham County, New Hampshire |
0.09 |
|
Bernalillo County, New Mexico |
0.09 |
|
Catawba County, North Carolina |
0.09 |
|
Muskogee County, Oklahoma |
0.09 |
|
Tulsa County, Oklahoma |
0.09 |
|
King County, Washington |
0.09 |
|
Washington County, Minnesota |
0.08 |
|
Buncombe County, North Carolina |
0.08 |
|
Butler County, Ohio |
0.08 |
|
Washington County, Oregon |
0.08 |
|
Placer County, California |
0.07 |
|
Unknown Or Undefined, California |
0.07 |
|
Escambia County, Florida |
0.07 |
|
Suffolk County, New York |
0.07 |
|
Hamilton County, Ohio |
0.07 |
|
Anderson County, South Carolina |
0.07 |
|
Miami-Dade County, Florida |
0.06 |
|
Allen County, Indiana |
0.06 |
|
Bristol County, Massachusetts |
0.06 |
|
Washoe County, Nevada |
0.06 |
|
Mercer County, New Jersey |
0.06 |
|
Nassau County, New York |
0.06 |
|
Lucas County, Ohio |
0.06 |
|
Salt Lake County, Utah |
0.06 |
|
Contra Costa County, California |
0.05 |
|
Hartford County, Connecticut |
0.05 |
|
Duval County, Florida |
0.05 |
|
Unknown Or Undefined, South Carolina |
0.05 |
|
Dallas County, Texas |
0.05 |
|
Pulaski County, Arkansas |
0.04 |
|
Los Angeles County, California |
0.04 |
|
Broward County, Florida |
0.04 |
|
Will County, Illinois |
0.04 |
|
Tippecanoe County, Indiana |
0.04 |
|
Caddo Parish, Louisiana |
0.04 |
|
Baltimore County, Maryland |
0.04 |
|
Hampden County, Massachusetts |
0.04 |
|
Wayne County, Michigan |
0.04 |
|
Jackson County, Missouri |
0.04 |
|
Somerset County, New Jersey |
0.04 |
|
Durham County, North Carolina |
0.04 |
|
Rutherford County, Tennessee |
0.04 |
|
Mobile County, Alabama |
0.03 |
|
Douglas County, Colorado |
0.03 |
|
Lake County, Indiana |
0.03 |
|
Jefferson County, Kentucky |
0.03 |
|
East Baton Rouge Parish, Louisiana |
0.03 |
|
Montgomery County, Maryland |
0.03 |
|
Oakland County, Michigan |
0.03 |
|
Montgomery County, Ohio |
0.03 |
|
Virginia Beach City, Virginia |
0.03 |
|
Orange County, California |
0.02 |
|
San Mateo County, California |
0.02 |
|
New Haven County, Connecticut |
0.02 |
|
Leon County, Florida |
0.02 |
|
Orange County, Florida |
0.02 |
|
Fulton County, Georgia |
0.02 |
|
Hennepin County, Minnesota |
0.02 |
|
Clark County, Nevada |
0.02 |
|
Oklahoma County, Oklahoma |
0.02 |
|
Gwinnett County, Georgia |
0.01 |
|
Johnson County, Kansas |
0.01 |
|
Prince George's County, Maryland |
0.01 |
|
St. Louis County, Missouri |
0.01 |
|
Queens County, New York |
0.01 |
|
Unknown Or Undefined, New York |
0.01 |
|
Cuyahoga County, Ohio |
0.01 |
|
Multnomah County, Oregon |
0.01 |
|
Source: U.S. Bureau of Labor Statistics, Quarterly Census of Employment and Wages. |
|
Note: The North American Industry Classification System groups this industry under “fruit and tree nut farming.” The OES survey excludes most of the agricultural sector, with the exception of logging, support activities for crop production, and support activities for animal production. The OES survey does not include the fruit and tree nut farming industry; therefore, occupation location quotients cannot be calculated.
| County | Location quotient |
|---|---|
|
Douglas County, Washington |
167.57 |
|
Okanogan County, Washington |
149.78 |
|
Lares Municipio, Puerto Rico |
116.31 |
|
Chelan County, Washington |
114.74 |
|
Hood River County, Oregon |
113.82 |
|
Adjuntas Municipio, Puerto Rico |
112.7 |
|
Grant County, Washington |
108.56 |
|
Yakima County, Washington |
98.26 |
|
Maricao Municipio, Puerto Rico |
97.88 |
|
Crawford County, Georgia |
89.04 |
| Source: U.S. Bureau of Labor Statistics, Quarterly Census of Employment and Wages. | |

| County | Location quotient |
|---|---|
|
Douglas County, Washington |
167.57 |
|
Okanogan County, Washington |
149.78 |
|
Lares Municipio, Puerto Rico |
116.31 |
|
Chelan County, Washington |
114.74 |
|
Hood River County, Oregon |
113.82 |
|
Adjuntas Municipio, Puerto Rico |
112.7 |
|
Grant County, Washington |
108.56 |
|
Yakima County, Washington |
98.26 |
|
Maricao Municipio, Puerto Rico |
97.88 |
|
Crawford County, Georgia |
89.04 |
|
Wasco County, Oregon |
79.14 |
|
Walla Walla County, Washington |
69.76 |
|
Glenn County, California |
62.39 |
|
Klickitat County, Washington |
61.35 |
|
Guayanilla Municipio, Puerto Rico |
58.67 |
|
Franklin County, Washington |
53.83 |
|
Las Marias Municipio, Puerto Rico |
51.45 |
|
Clinch County, Georgia |
50.78 |
|
Sutter County, California |
46.47 |
|
San Sebastian Municipio, Puerto Rico |
41.25 |
|
Colusa County, California |
40.68 |
|
Jayuya Municipio, Puerto Rico |
39.85 |
|
Santa Cruz County, California |
39.47 |
|
Barranquitas Municipio, Puerto Rico |
38.41 |
|
Monterey County, California |
37.94 |
|
Adams County, Washington |
36.71 |
|
Orocovis Municipio, Puerto Rico |
35.39 |
|
Yauco Municipio, Puerto Rico |
34.93 |
|
Utuado Municipio, Puerto Rico |
34.68 |
|
Benton County, Washington |
34.06 |
|
Madera County, California |
34.02 |
|
Oceana County, Michigan |
33.43 |
|
Van Buren County, Michigan |
32.71 |
|
Ventura County, California |
32.47 |
|
Tehama County, California |
32.44 |
|
Irwin County, Georgia |
28.63 |
|
Bacon County, Georgia |
28.59 |
|
Kern County, California |
27.97 |
|
Wayne County, New York |
27.53 |
|
Hardee County, Florida |
26.38 |
|
Sabana Grande Municipio, Puerto Rico |
26.03 |
|
Tulare County, California |
25.98 |
|
Merced County, California |
24.8 |
|
Santa Barbara County, California |
23.93 |
|
Orleans County, New York |
23.45 |
|
Leelanau County, Michigan |
22.53 |
|
Fresno County, California |
22.44 |
|
Napa County, California |
21.4 |
|
Peach County, Georgia |
21.37 |
|
Salinas Municipio, Puerto Rico |
20.11 |
|
Antrim County, Michigan |
19.98 |
|
Hendry County, Florida |
19.61 |
|
Highlands County, Florida |
18.93 |
|
Berrien County, Georgia |
18.85 |
|
Adams County, Pennsylvania |
18.65 |
|
Moca Municipio, Puerto Rico |
18.46 |
|
DeSoto County, Florida |
17.95 |
|
Santa Isabel Municipio, Puerto Rico |
17.92 |
|
Mendocino County, California |
17.85 |
|
Coamo Municipio, Puerto Rico |
16.99 |
|
Comerio Municipio, Puerto Rico |
16.99 |
|
Appling County, Georgia |
16.19 |
|
Yuba County, California |
15.17 |
|
Union County, Illinois |
14.86 |
|
Yabucoa Municipio, Puerto Rico |
14.45 |
|
Whatcom County, Washington |
14.04 |
|
Butte County, California |
14.02 |
|
Corozal Municipio, Puerto Rico |
13.93 |
|
Stanislaus County, California |
13.88 |
|
Kings County, California |
13.58 |
|
Edgefield County, South Carolina |
13.49 |
|
Yamhill County, Oregon |
13.48 |
|
Maunabo Municipio, Puerto Rico |
13.03 |
|
Ciales Municipio, Puerto Rico |
12.59 |
|
Washington County, Maine |
12.56 |
|
Juana Diaz Municipio, Puerto Rico |
12.37 |
|
San Joaquin County, California |
12.02 |
|
Umatilla County, Oregon |
11.9 |
|
Yates County, New York |
11.4 |
|
Jackson County, Wisconsin |
11.28 |
|
Bladen County, North Carolina |
11.25 |
|
Pender County, North Carolina |
11.08 |
|
San Benito County, California |
10.09 |
|
Lake County, California |
10.04 |
|
Naranjito Municipio, Puerto Rico |
9.4 |
|
Villalba Municipio, Puerto Rico |
9.22 |
|
Hawaii County, Hawaii |
9.19 |
|
Columbia County, New York |
9.17 |
|
Comanche County, Texas |
8.87 |
|
Sonoma County, California |
8.81 |
|
Delta County, Colorado |
8.62 |
|
Manati Municipio, Puerto Rico |
8.41 |
|
Mason County, Michigan |
8.2 |
|
Lajas Municipio, Puerto Rico |
8 |
|
Ulster County, New York |
7.91 |
|
Clinton County, New York |
7.88 |
|
Crawford County, Wisconsin |
7.57 |
|
Patillas Municipio, Puerto Rico |
7.5 |
|
Aguas Buenas Municipio, Puerto Rico |
7.07 |
|
Polk County, Oregon |
7.06 |
|
Dona Ana County, New Mexico |
6.54 |
|
Atlantic County, New Jersey |
6.15 |
|
Wood County, Wisconsin |
6.04 |
|
Skagit County, Washington |
5.74 |
|
Okeechobee County, Florida |
5.64 |
|
Ottawa County, Michigan |
5.52 |
|
Ware County, Georgia |
5.5 |
|
Canyon County, Idaho |
5.27 |
|
Indian River County, Florida |
4.98 |
|
Jackson County, Oregon |
4.9 |
|
Albemarle County, Virginia |
4.87 |
|
lsabela Municipio, Puerto Rico |
4.83 |
|
Suwannee County, Florida |
4.76 |
|
Mitchell County, Georgia |
4.63 |
|
Hillsborough County, Florida |
4.56 |
|
San Lorenzo Municipio, Puerto Rico |
4.53 |
|
Naguabo Municipio, Puerto Rico |
4.47 |
|
Trempealeau County, Wisconsin |
4.36 |
|
Yolo County, California |
4.34 |
|
Cochise County, Arizona |
4.33 |
|
Luna County, New Mexico |
4.26 |
|
Frederick County, Virginia |
4.21 |
|
Kauai County, Hawaii |
4.19 |
|
Amador County, California |
4.15 |
|
Montcalm County, Michigan |
3.98 |
|
Curry County, Oregon |
3.93 |
|
Morovis Municipio, Puerto Rico |
3.93 |
|
Manatee County, Florida |
3.65 |
|
Bedford County, Pennsylvania |
3.61 |
|
Henderson County, North Carolina |
3.5 |
|
Berrien County, Michigan |
3.47 |
|
San German Municipio, Puerto Rico |
3.42 |
|
Addison County, Vermont |
3.41 |
|
San Luis Obispo County, California |
3.39 |
|
Aguada Municipio, Puerto Rico |
3.3 |
|
Yuma County, Arizona |
3.29 |
|
Vilas County, Wisconsin |
3.27 |
|
Las Piedras Municipio, Puerto Rico |
3.22 |
|
Polk County, Florida |
3.15 |
|
Muskegon County, Michigan |
3.07 |
|
Adams County, Wisconsin |
3.02 |
|
Riverside County, California |
2.92 |
|
Marion County, Oregon |
2.9 |
|
Newaygo County, Michigan |
2.89 |
|
Otero County, New Mexico |
2.83 |
|
Allegan County, Michigan |
2.8 |
|
Niagara County, New York |
2.75 |
|
Sumter County, Georgia |
2.53 |
|
Door County, Wisconsin |
2.48 |
|
Alachua County, Florida |
2.45 |
|
Douglas County, Oregon |
2.45 |
|
Cowlitz County, Washington |
2.43 |
|
Oxford County, Maine |
2.38 |
|
Chaves County, New Mexico |
2.33 |
|
El Dorado County, California |
2.32 |
|
Bastrop County, Texas |
2.3 |
|
Mesa County, Colorado |
2.24 |
|
Citrus County, Florida |
2.21 |
|
St. Lucie County, Florida |
2.14 |
|
Oneida County, Wisconsin |
2.14 |
|
Rockingham County, Virginia |
2.12 |
|
Dougherty County, Georgia |
1.94 |
|
Chautauqua County, New York |
1.9 |
|
Union County, Oregon |
1.88 |
|
Solano County, California |
1.85 |
|
Klamath County, Oregon |
1.79 |
|
San Saba County, Texas |
1.79 |
|
Eddy County, New Mexico |
1.73 |
|
Hidalgo County, Texas |
1.73 |
|
Washburn County, Wisconsin |
1.68 |
|
Clackamas County, Oregon |
1.65 |
|
Oswego County, New York |
1.63 |
|
Vega Baja Municipio, Puerto Rico |
1.57 |
|
Payette County, Idaho |
1.5 |
|
Ponce Municipio, Puerto Rico |
1.5 |
|
Maui + Kalawao County, Hawaii |
1.49 |
|
Cabo Rojo Municipio, Puerto Rico |
1.48 |
|
Imperial County, California |
1.41 |
|
Washington County, Oregon |
1.34 |
|
Lee County, Florida |
1.33 |
|
Arecibo Municipio, Puerto Rico |
1.29 |
|
Rio Grande Municipio, Puerto Rico |
1.27 |
|
Charlotte County, Florida |
1.2 |
|
Toa Alta Municipio, Puerto Rico |
1.17 |
|
Franklin County, Massachusetts |
1.11 |
|
Lake County, Florida |
1.08 |
|
Kent County, Michigan |
1.06 |
|
Mayaguez Municipio, Puerto Rico |
1.02 |
|
Multnomah County, Oregon |
0.99 |
|
Plymouth County, Massachusetts |
0.98 |
|
Jefferson County, West Virginia |
0.97 |
|
Dorado Municipio, Puerto Rico |
0.96 |
|
Grand Traverse County, Michigan |
0.84 |
|
Cayey Municipio, Puerto Rico |
0.84 |
|
Utah County, Utah |
0.83 |
|
Sacramento County, California |
0.82 |
|
Washington County, Minnesota |
0.79 |
|
San Diego County, California |
0.77 |
|
Franklin County, Pennsylvania |
0.77 |
|
Windham County, Vermont |
0.76 |
|
Dutchess County, New York |
0.75 |
|
Grays Harbor County, Washington |
0.75 |
|
Burlington County, New Jersey |
0.7 |
|
Frio County, Texas |
0.7 |
|
Gillespie County, Texas |
0.7 |
|
York County, Pennsylvania |
0.64 |
|
Androscoggin County, Maine |
0.58 |
|
Worcester County, Massachusetts |
0.57 |
|
Marion County, Florida |
0.55 |
|
Berks County, Pennsylvania |
0.54 |
|
Honolulu County, Hawaii |
0.52 |
|
Benton County, Oregon |
0.49 |
|
Portage County, Wisconsin |
0.49 |
|
Lane County, Oregon |
0.48 |
|
Erie County, Pennsylvania |
0.47 |
|
Clark County, Washington |
0.46 |
|
Coos County, Oregon |
0.45 |
|
El Paso County, Texas |
0.45 |
|
Plaquemines Parish, Louisiana |
0.44 |
|
York County, South Carolina |
0.43 |
|
Rockingham County, New Hampshire |
0.42 |
|
Spartanburg County, South Carolina |
0.42 |
|
Macomb County, Michigan |
0.41 |
|
Cleveland County, North Carolina |
0.4 |
|
Contra Costa County, California |
0.39 |
|
Hancock County, Maine |
0.39 |
|
Saratoga County, New York |
0.39 |
|
Washington County, Maryland |
0.36 |
|
Berkshire County, Massachusetts |
0.32 |
|
Gloucester County, New Jersey |
0.31 |
|
Tift County, Georgia |
0.3 |
|
Santa Clara County, California |
0.29 |
|
Chester County, Pennsylvania |
0.29 |
|
Placer County, California |
0.26 |
|
Caguas Municipio, Puerto Rico |
0.26 |
|
Washtenaw County, Michigan |
0.25 |
|
Osceola County, Florida |
0.24 |
|
Kenosha County, Wisconsin |
0.24 |
|
Orange County, California |
0.23 |
|
San Bernardino County, California |
0.23 |
|
Marin County, California |
0.22 |
|
Orange County, Florida |
0.22 |
|
Sarasota County, Florida |
0.22 |
|
Hernando County, Florida |
0.2 |
|
Houston County, Georgia |
0.2 |
|
Lehigh County, Pennsylvania |
0.2 |
|
Thurston County, Washington |
0.2 |
|
Bayamon Municipio, Puerto Rico |
0.17 |
|
Los Angeles County, California |
0.16 |
|
Norfolk County, Massachusetts |
0.16 |
|
Suffolk County, New York |
0.14 |
|
Monroe County, New York |
0.13 |
|
Chittenden County, Vermont |
0.13 |
|
Shasta County, California |
0.12 |
|
Brevard County, Florida |
0.12 |
|
Cumberland County, Maine |
0.12 |
|
Snohomish County, Washington |
0.12 |
|
Unknown Or Undefined, Michigan |
0.11 |
|
Middlesex County, Massachusetts |
0.1 |
|
San Juan Municipio, Puerto Rico |
0.1 |
|
Erie County, New York |
0.09 |
|
San Mateo County, California |
0.07 |
|
Unknown Or Undefined, California |
0.07 |
|
Providence County, Rhode Island |
0.07 |
|
Montgomery County, Maryland |
0.06 |
|
Bristol County, Massachusetts |
0.06 |
|
Unknown Or Undefined, Florida |
0.04 |
|
Maricopa County, Arizona |
0.03 |
|
Alameda County, California |
0.03 |
|
Palm Beach County, Florida |
0.03 |
|
Bexar County, Texas |
0.02 |
|
San Francisco County, California |
0.01 |
|
Broward County, Florida |
0.01 |
|
Travis County, Texas |
0.01 |
|
Source: U.S. Bureau of Labor Statistics, Quarterly Census of Employment and Wages. |
|
| County | Location quotient |
|---|---|
|
Mingo County, West Virginia |
475.42 |
|
Boone County, West Virginia |
474.38 |
|
Campbell County, Wyoming |
390.57 |
|
Greene County, Pennsylvania |
386.95 |
|
Buchanan County, Virginia |
320.3 |
|
Martin County, Kentucky |
253.99 |
|
Logan County, West Virginia |
244.36 |
|
Perry County, Kentucky |
218.08 |
|
Leslie County, Kentucky |
211.69 |
|
Carbon County, Utah |
146.01 |
| Source: U.S. Bureau of Labor Statistics, Quarterly Census of Employment and Wages. | |

| County | Location quotient |
|---|---|
|
Mingo County, West Virginia |
475.42 |
|
Boone County, West Virginia |
474.38 |
|
Campbell County, Wyoming |
390.57 |
|
Greene County, Pennsylvania |
386.95 |
|
Buchanan County, Virginia |
320.3 |
|
Martin County, Kentucky |
253.99 |
|
Logan County, West Virginia |
244.36 |
|
Perry County, Kentucky |
218.08 |
|
Leslie County, Kentucky |
211.69 |
|
Carbon County, Utah |
146.01 |
|
Raleigh County, West Virginia |
120.77 |
|
Letcher County, Kentucky |
116.29 |
|
Bell County, Kentucky |
107.4 |
|
Pike County, Indiana |
85.7 |
|
Nicholas County, West Virginia |
59.23 |
|
Warrick County, Indiana |
45.27 |
|
Johnson County, Kentucky |
40.15 |
|
Kanawha County, West Virginia |
26.02 |
|
Clearfield County, Pennsylvania |
19.47 |
|
Jefferson County, Pennsylvania |
15.02 |
|
Knox County, Kentucky |
9.68 |
|
Jefferson County, Alabama |
7.99 |
|
Cambria County, Pennsylvania |
6.16 |
|
Harrison County, West Virginia |
5.64 |
|
Northumberland County, Pennsylvania |
4.99 |
|
Luzerne County, Pennsylvania |
3.96 |
|
Butler County, Pennsylvania |
2.48 |
|
Westmoreland County, Pennsylvania |
1.19 |
|
Stark County, Ohio |
0.19 |
|
Centre County, Pennsylvania |
0.19 |
|
Allegheny County, Pennsylvania |
0.05 |
|
Harris County, Texas |
0.01 |
|
Source: U.S. Bureau of Labor Statistics, Quarterly Census of Employment and Wages. |
|
| Occupation | Percent of occupation in coal mining | Total employment | Employment in coal mining |
|---|---|---|---|
| Mine shuttle car operators | 93.5 | 2,310 | 2,160 |
| Roof bolters, mining | 93.1 | 5,220 | 4,860 |
| Loading machine operators, underground mining | 60.7 | 3,210 | 1,950 |
| Source: U.S. Bureau of Labor Statistics, Occupational Employment Statistics. | |||
| Area | Location quotient |
|---|---|
|
Southern West Virginia nonmetropolitan area |
163.50 |
|
Beckley, West Virginia |
129.21 |
|
West Kentucky nonmetropolitan area |
115.49 |
|
East Kentucky nonmetropolitan area |
108.35 |
|
Northern West Virginia nonmetropolitan area |
72.26 |
|
Western Pennsylvania nonmetropolitan area |
64.46 |
|
Eastern Utah nonmetropolitan area |
43.92 |
|
Southwest Wyoming nonmetropolitan area |
35.43 |
|
Southwest Colorado nonmetropolitan area |
22.34 |
| Source: U.S. Bureau of Labor Statistics, Occupational Employment Statistics. | |
Elizabeth Cross is an economist in the Office of Occupational Statistics and Employment Projections, BLS. She can be reached at cross.elizabeth@bls.gov.
Elizabeth Cross, "Mapping “The Hunger Games”: Using location quotients to find the Districts of Panem," Career Outlook, U.S. Bureau of Labor Statistics, February 2017.